Community Analytics gives you insights into how your community is growing and how members are engaging with your content.
From the Analytics dashboard, you can track member growth, engagement activity, content usage, and device visits.
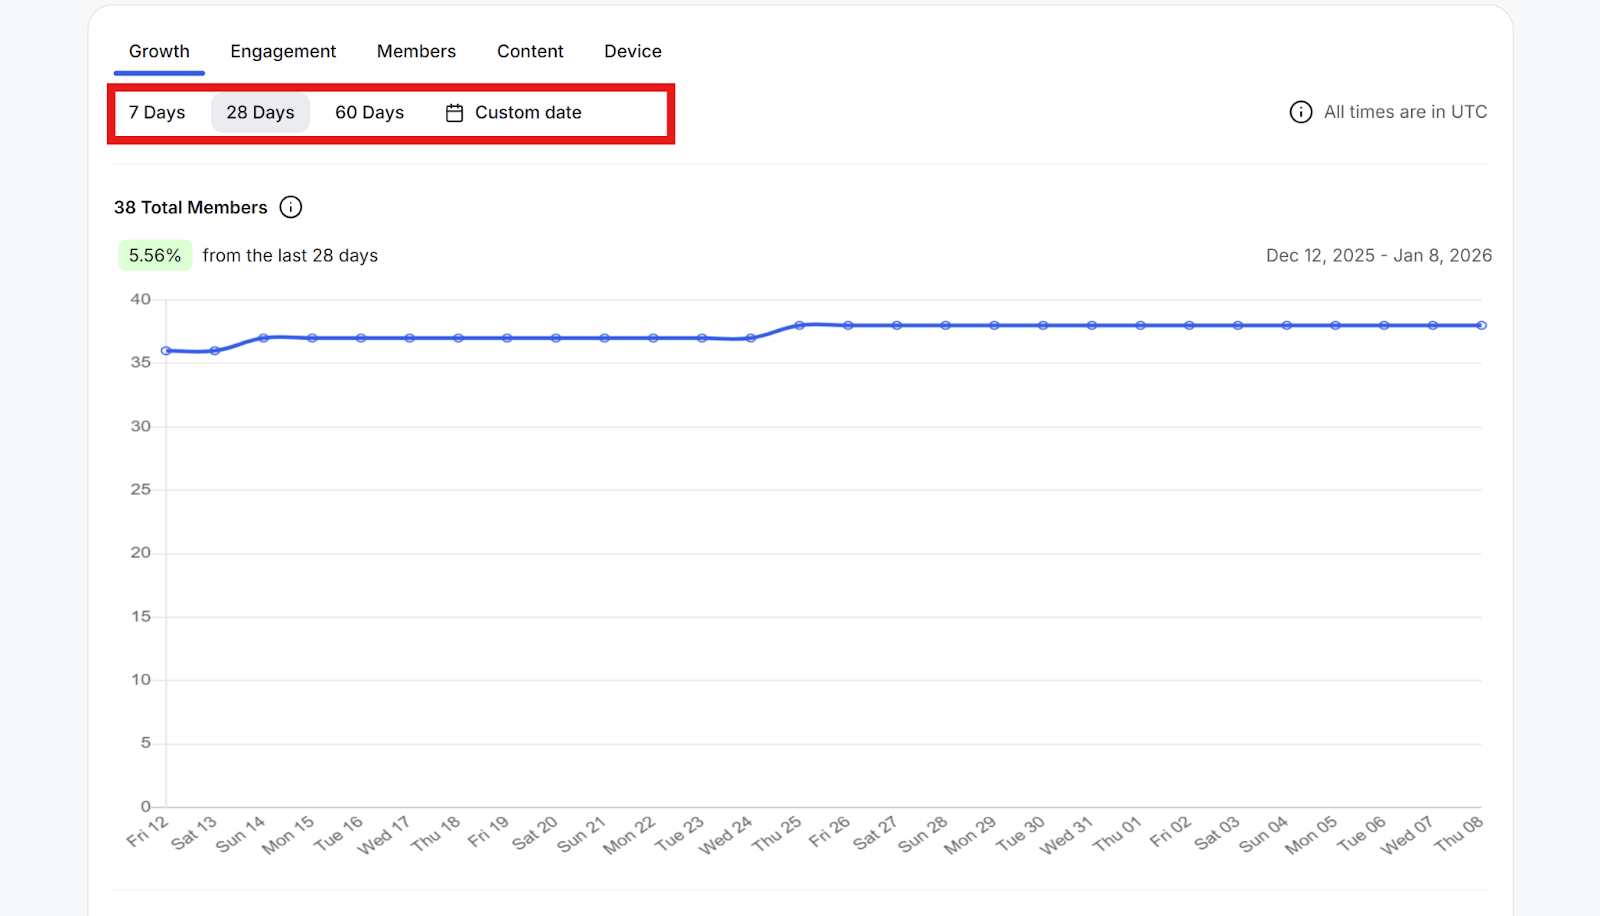
Please note that analytics data cannot be downloaded and is displayed directly within the dashboard. All timestamps in analytics are shown in UTC to keep reporting consistent when members and admins are located in different time zones.
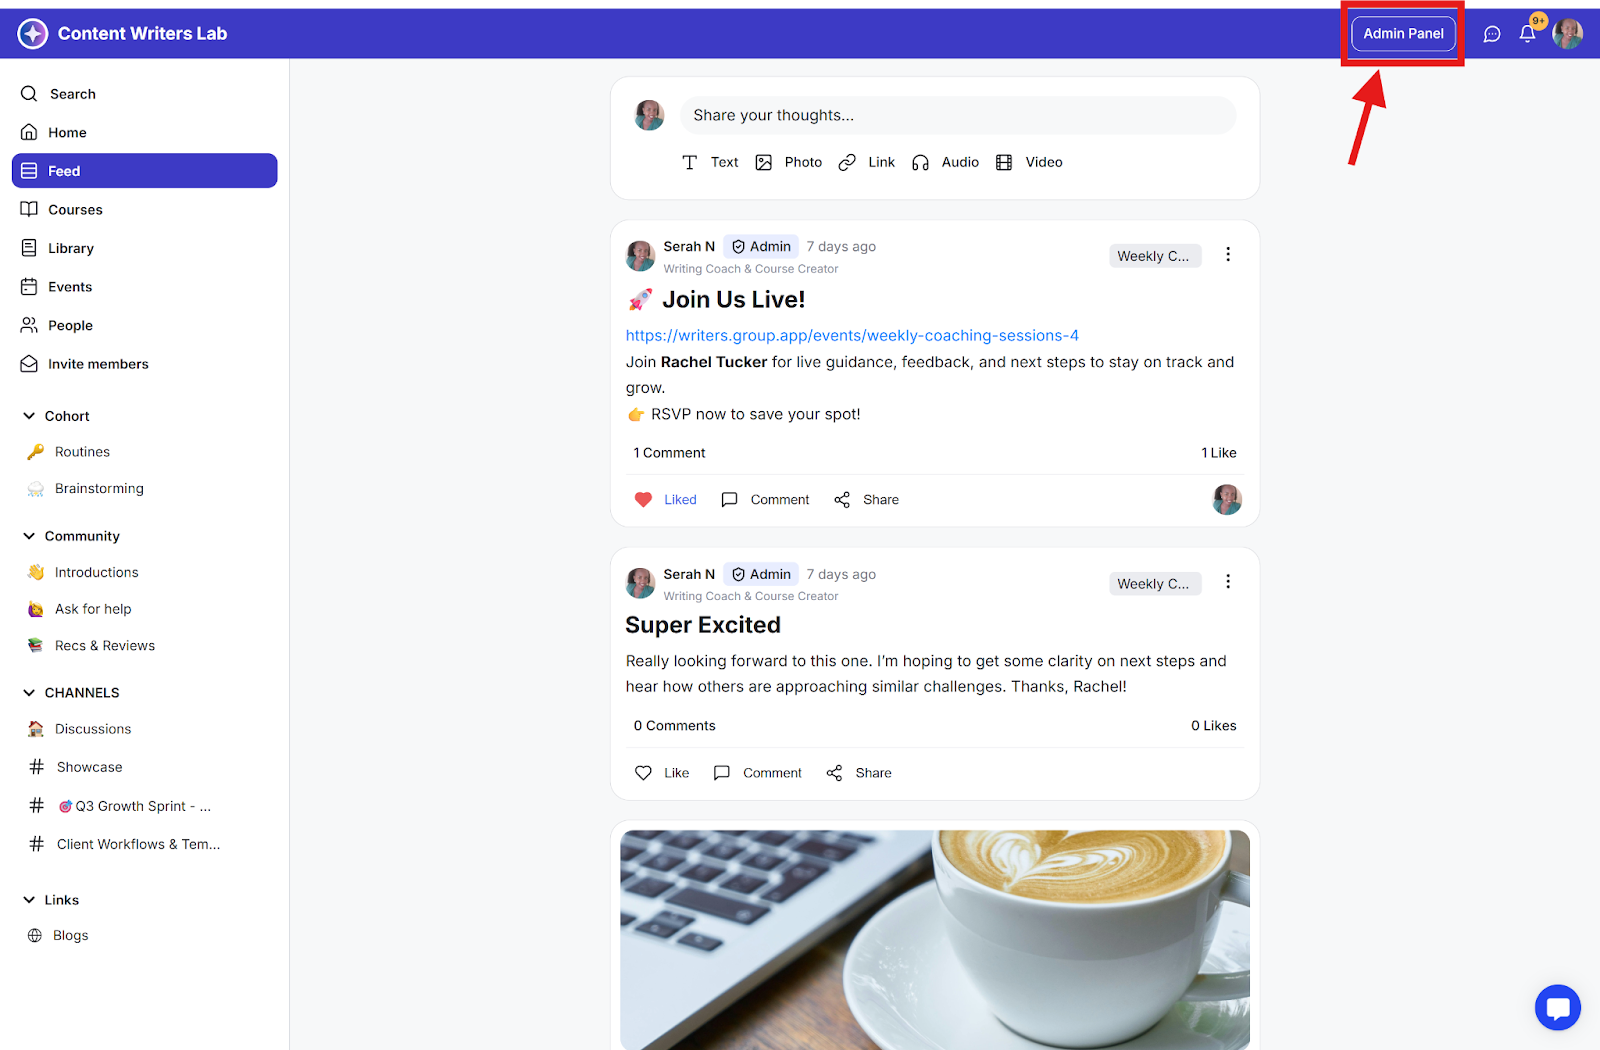
Step 1: Click the Admin Panel button.
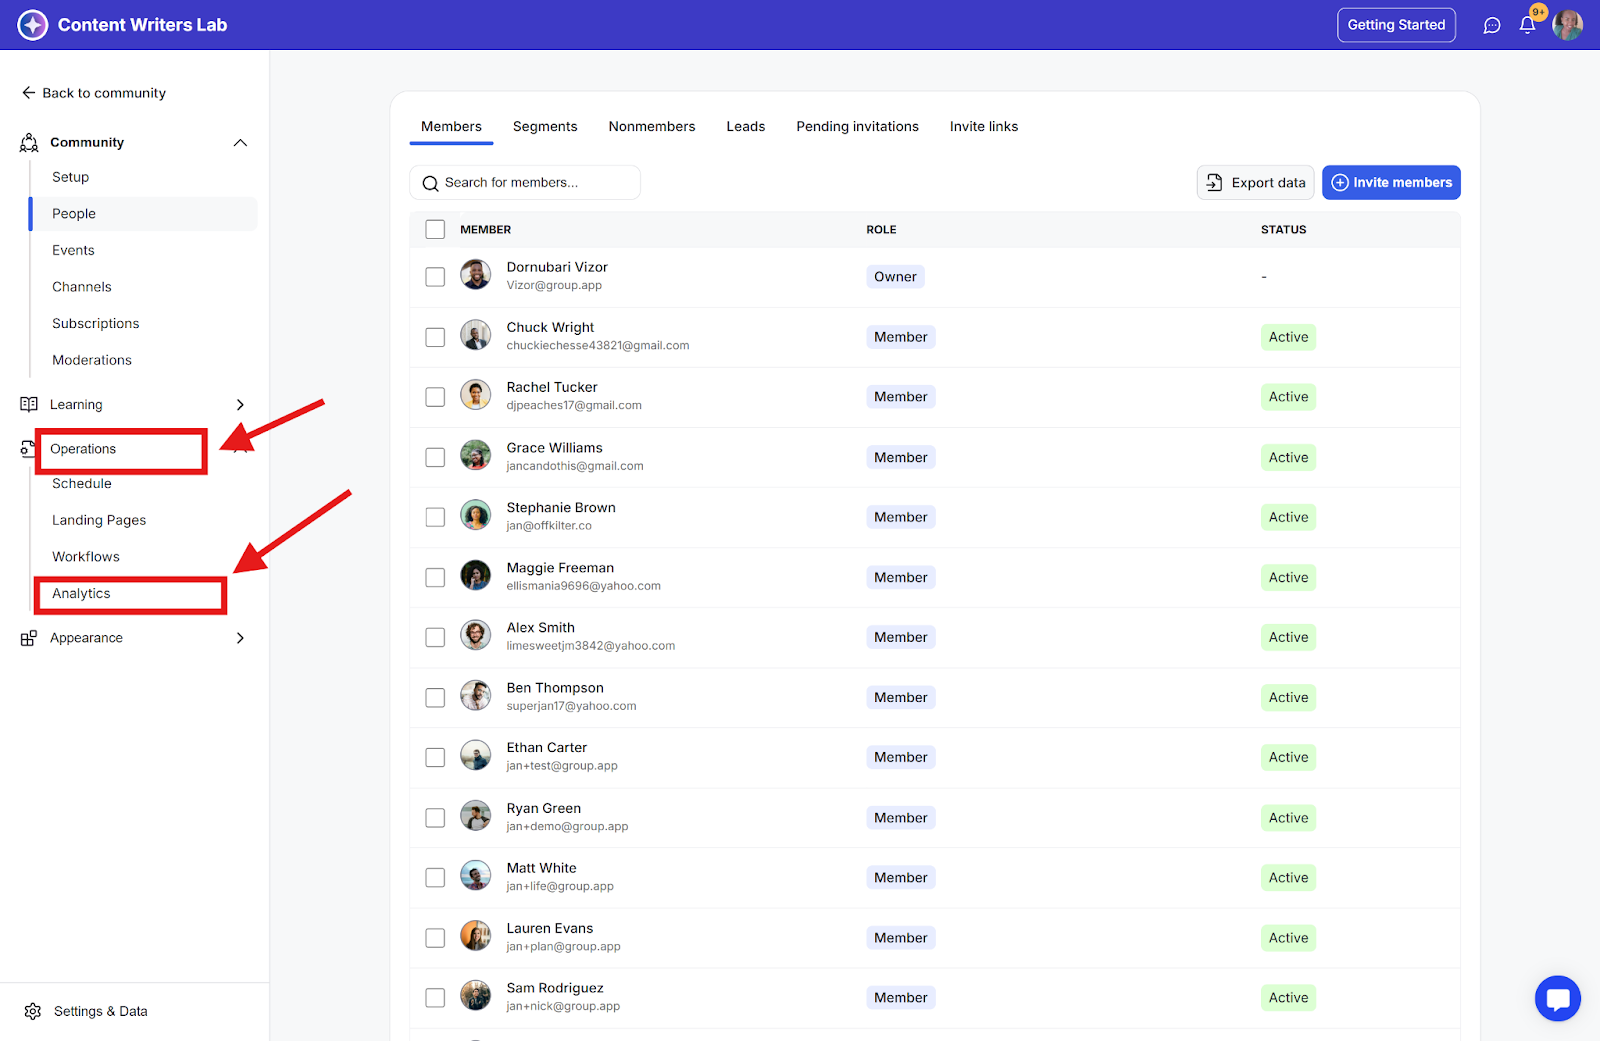
Step 2: Click Operations on the side menu and select Analytics.
GroupApp community Analytics is divided into 5 main groups:
This section displays 3 charts:
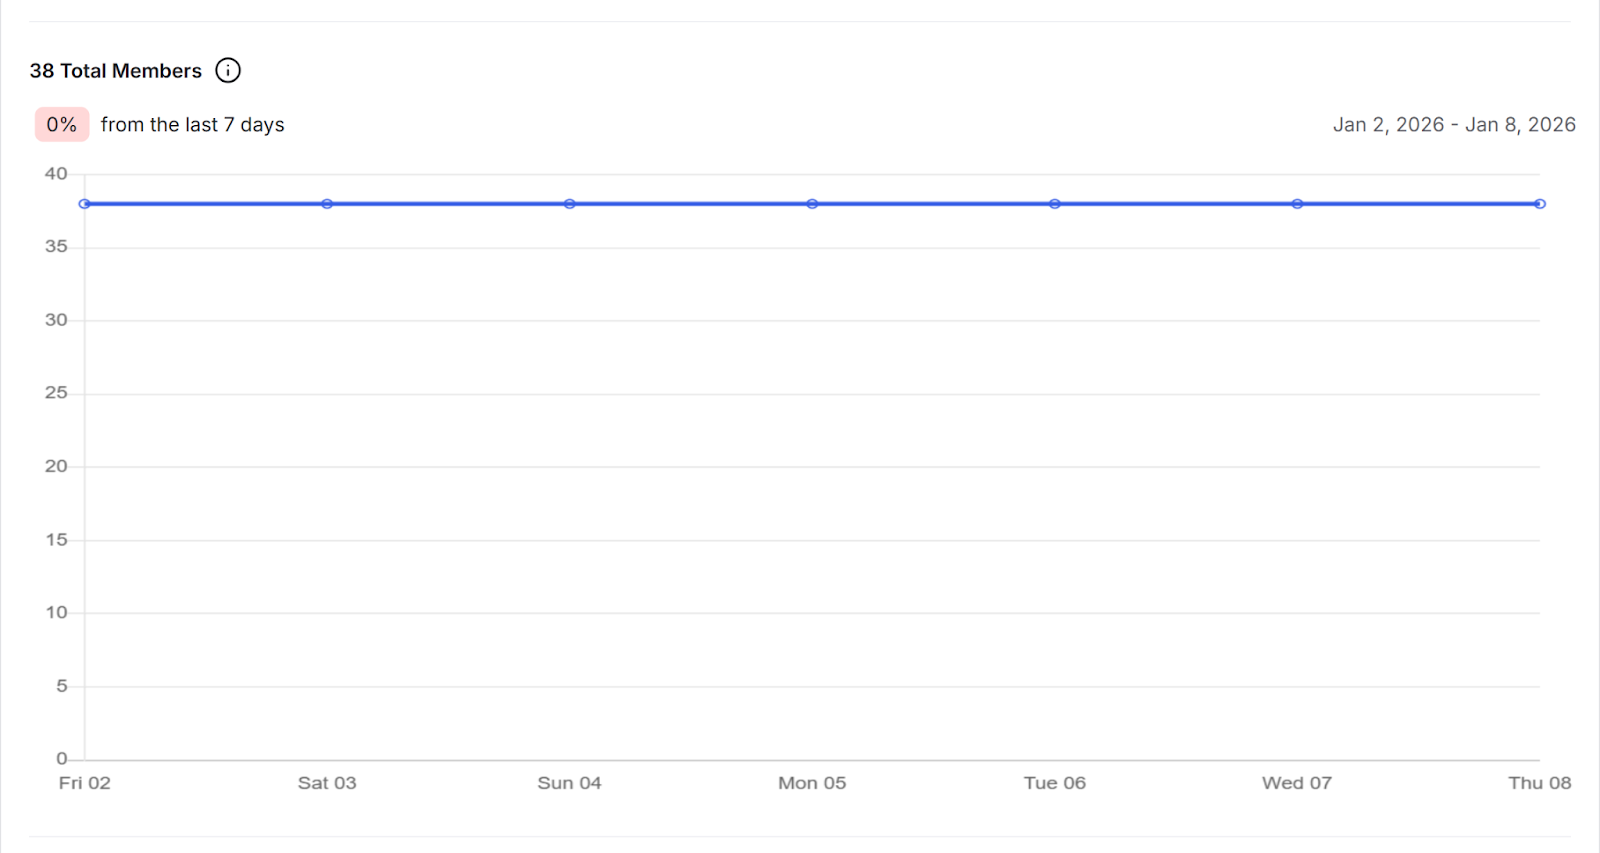
Total Members: Total number of members in your community.
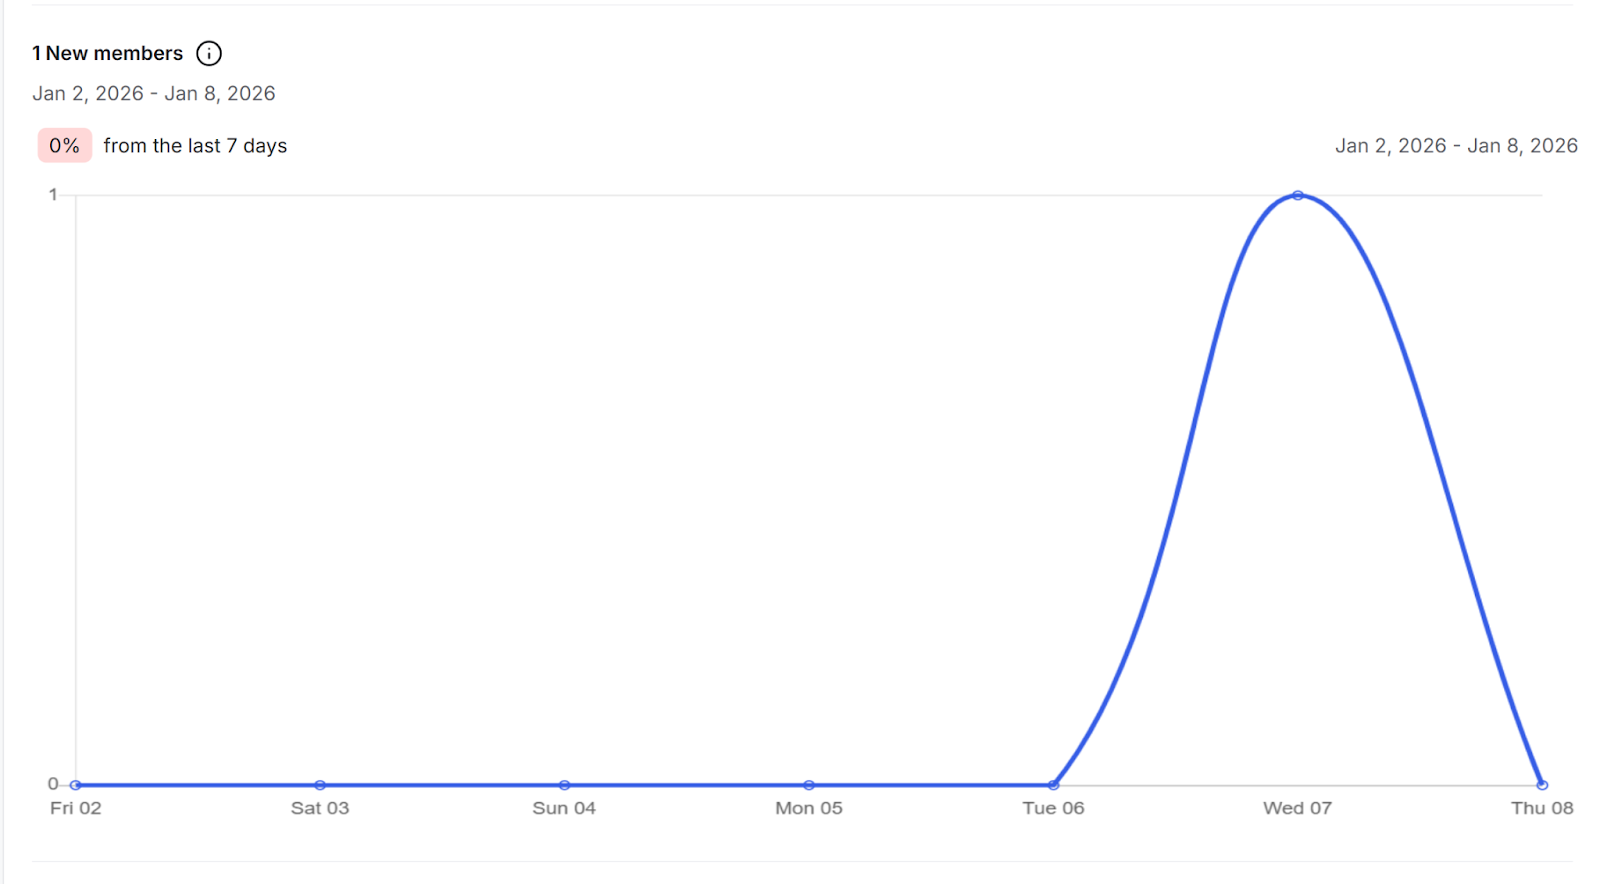
New members: The number of new members who joined your community.
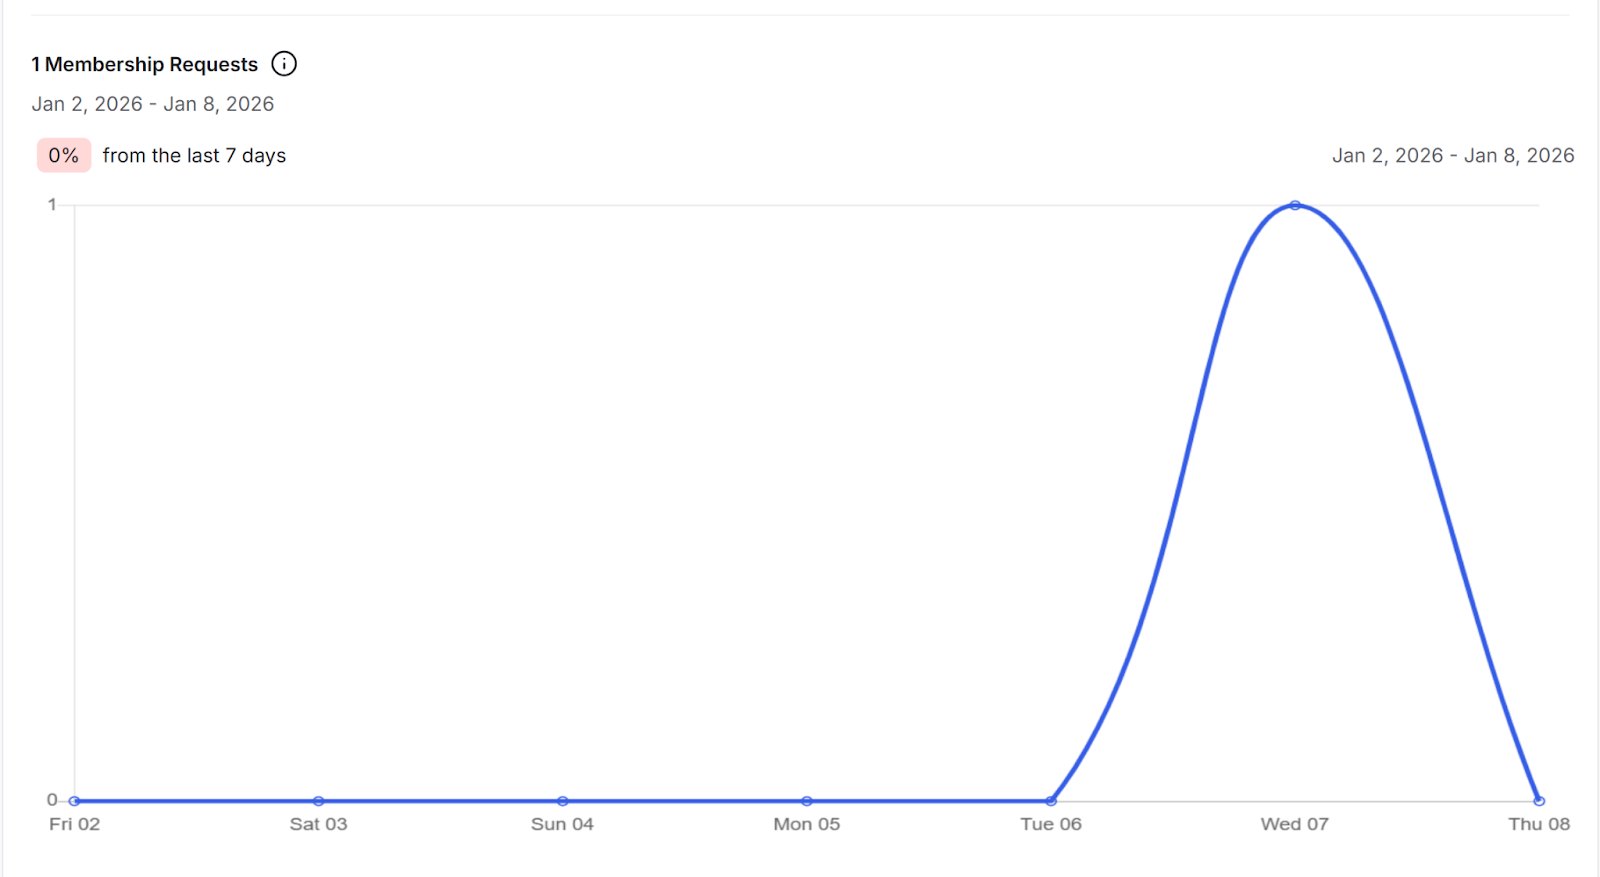
Membership Requests: The number of people who have requested to join your community.
This section displays 4 charts:
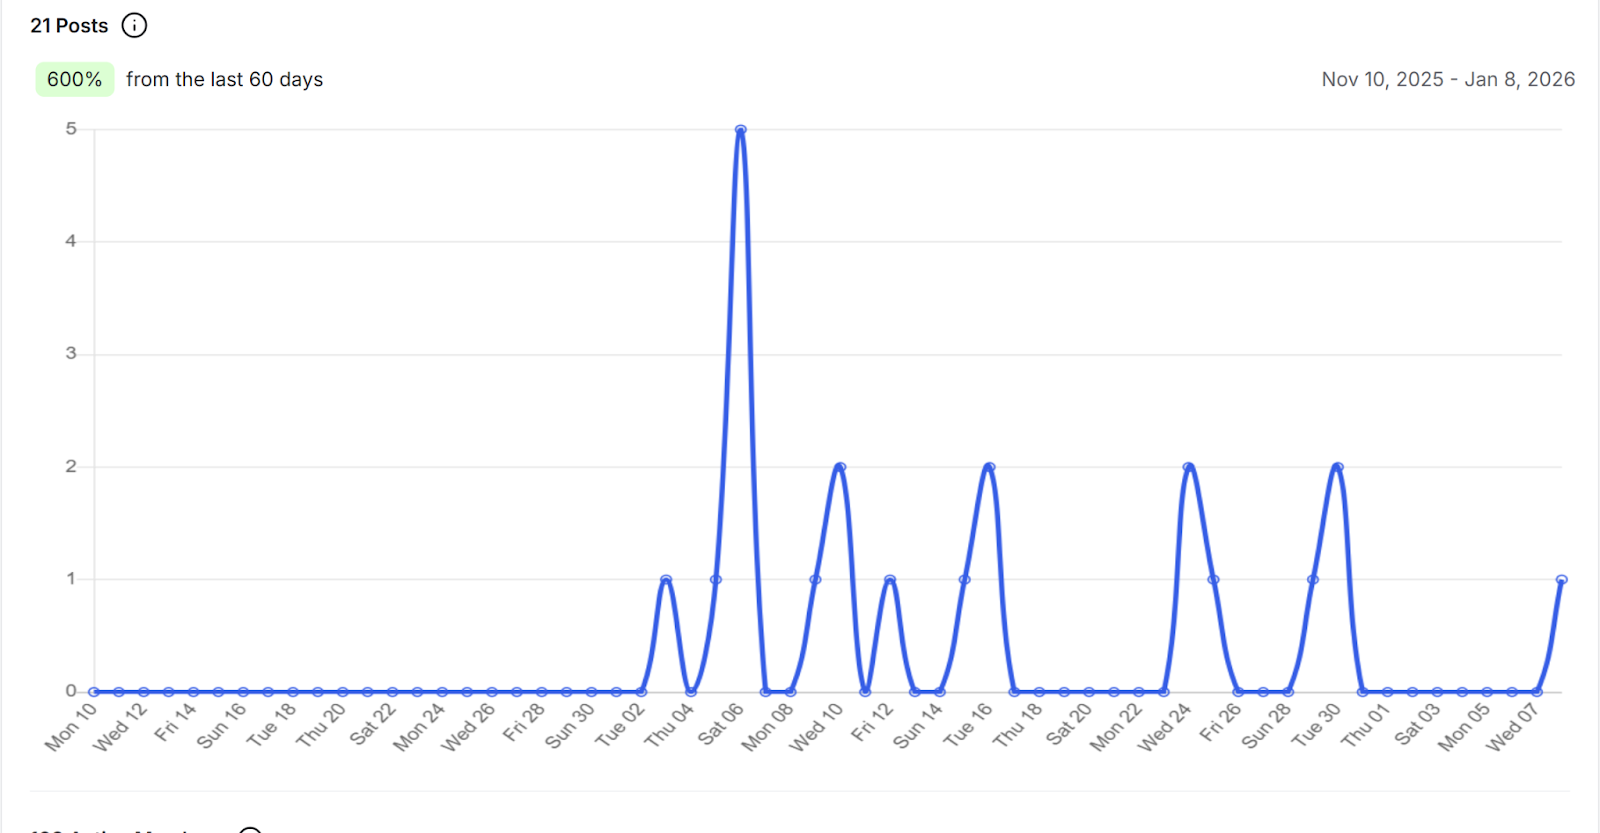
Posts: The number of posts created.
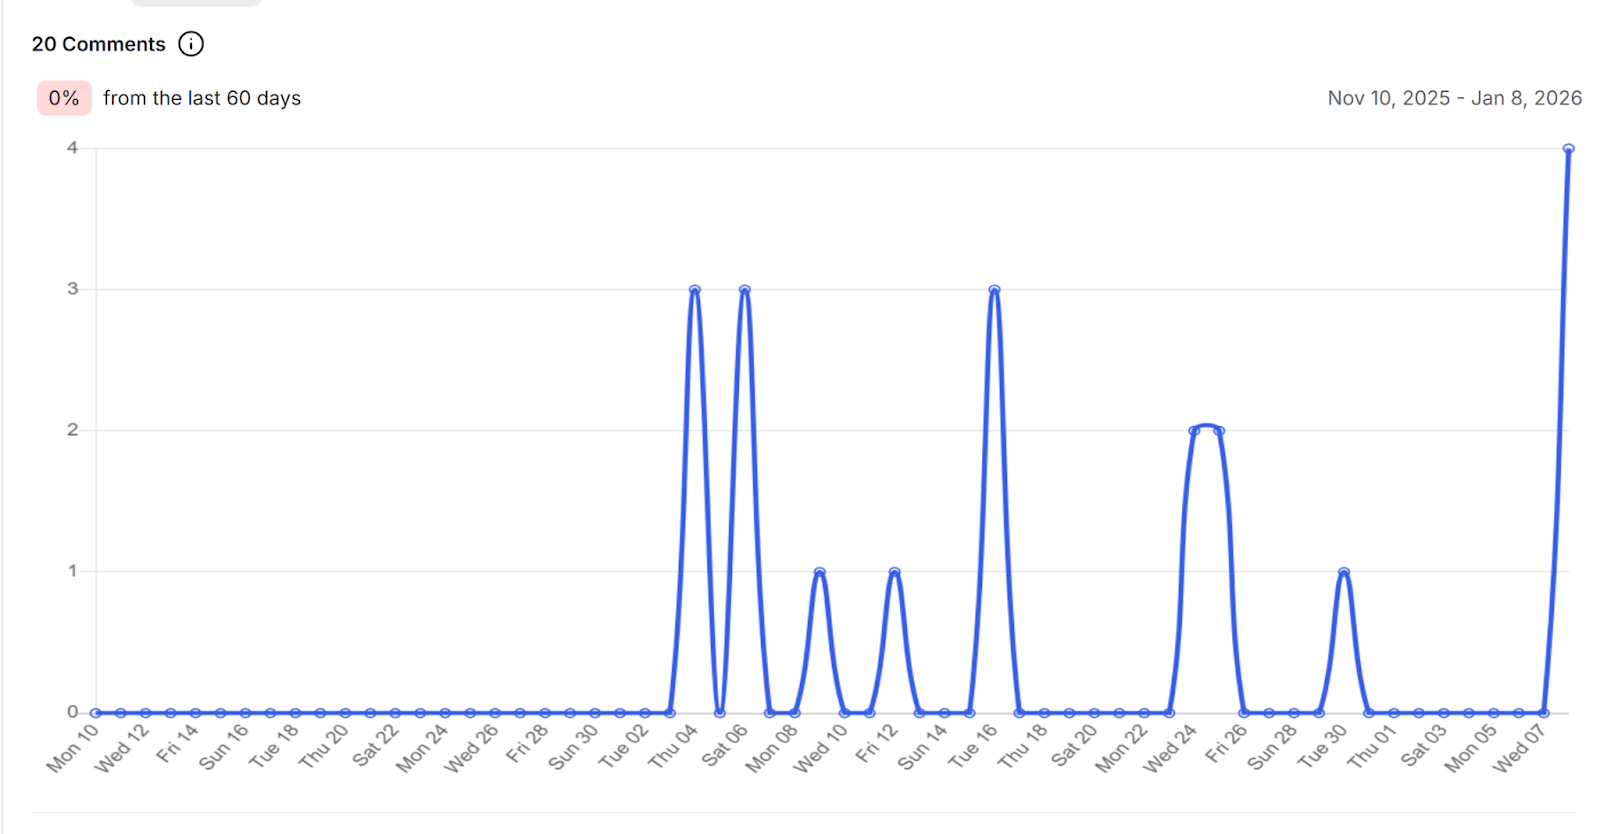
Comments: The number of comments created.
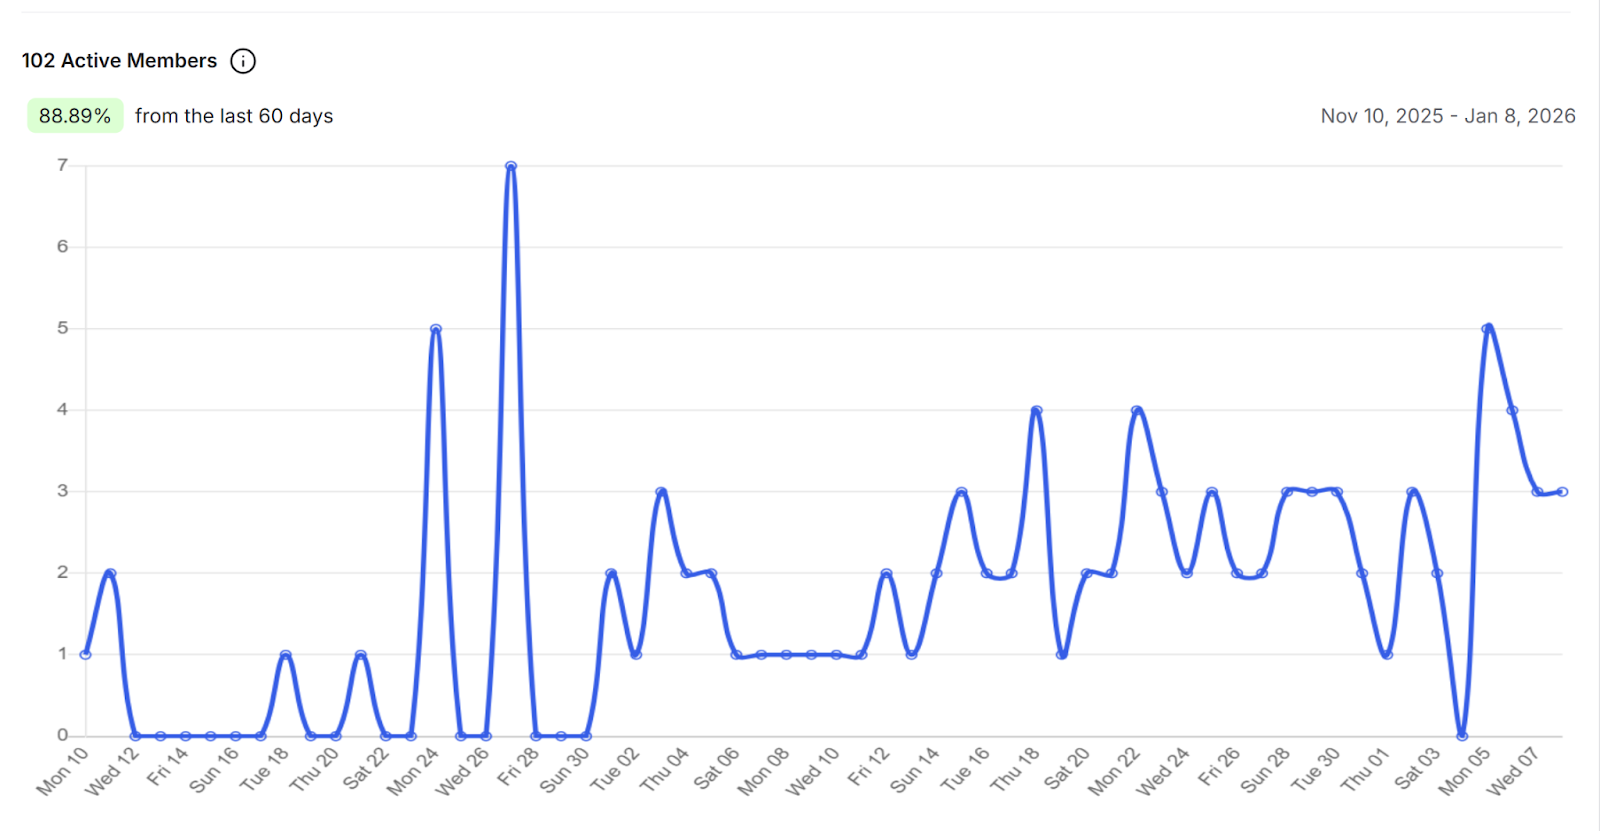
Active Members: The number of unique members who visited your community.
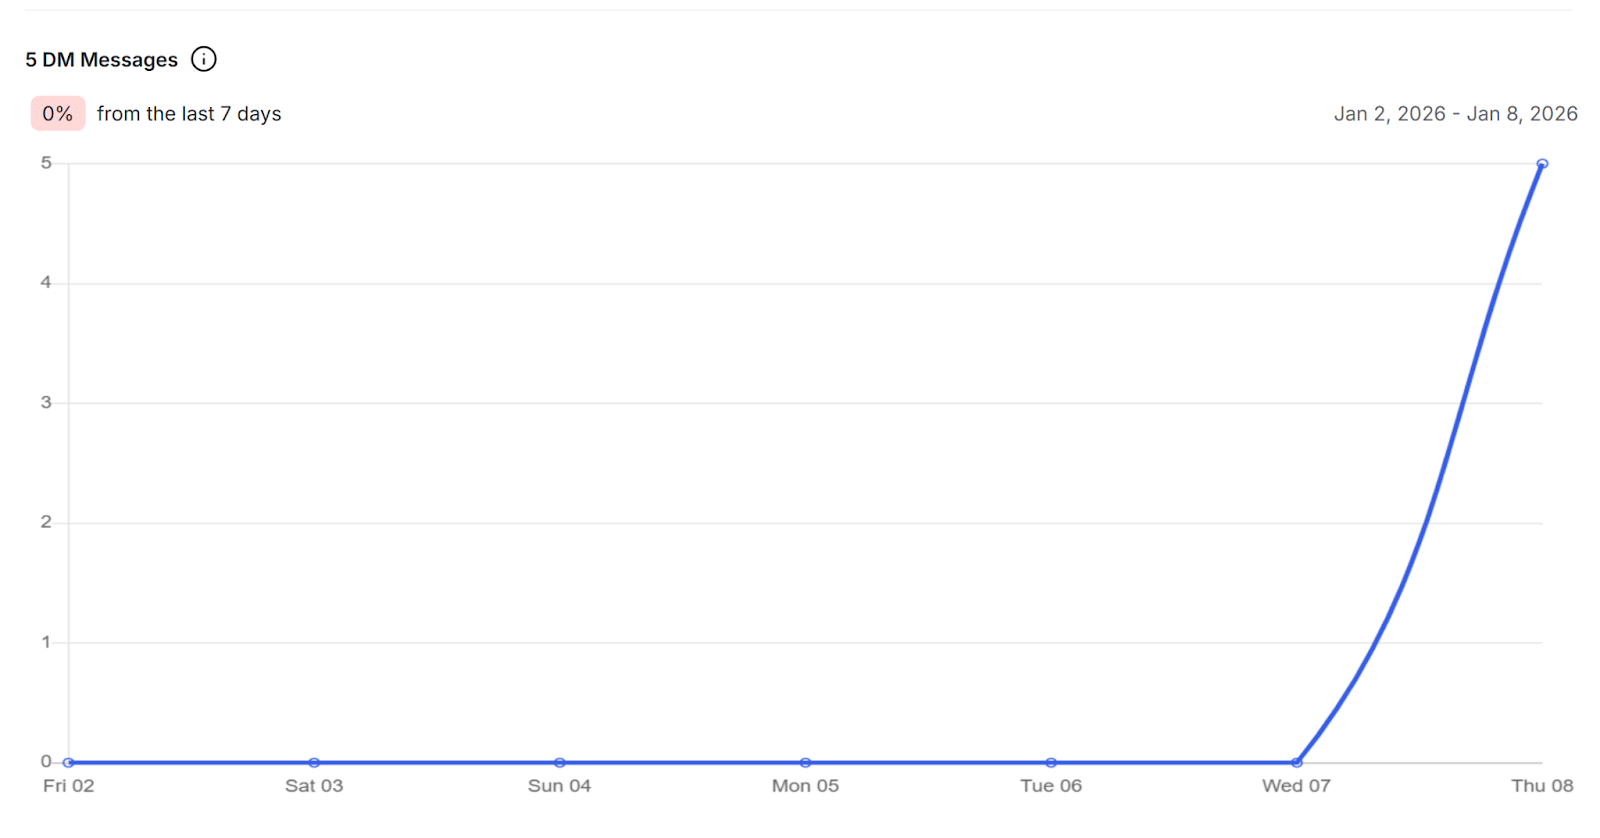
DM Messages: The number of direct messages sent by members.
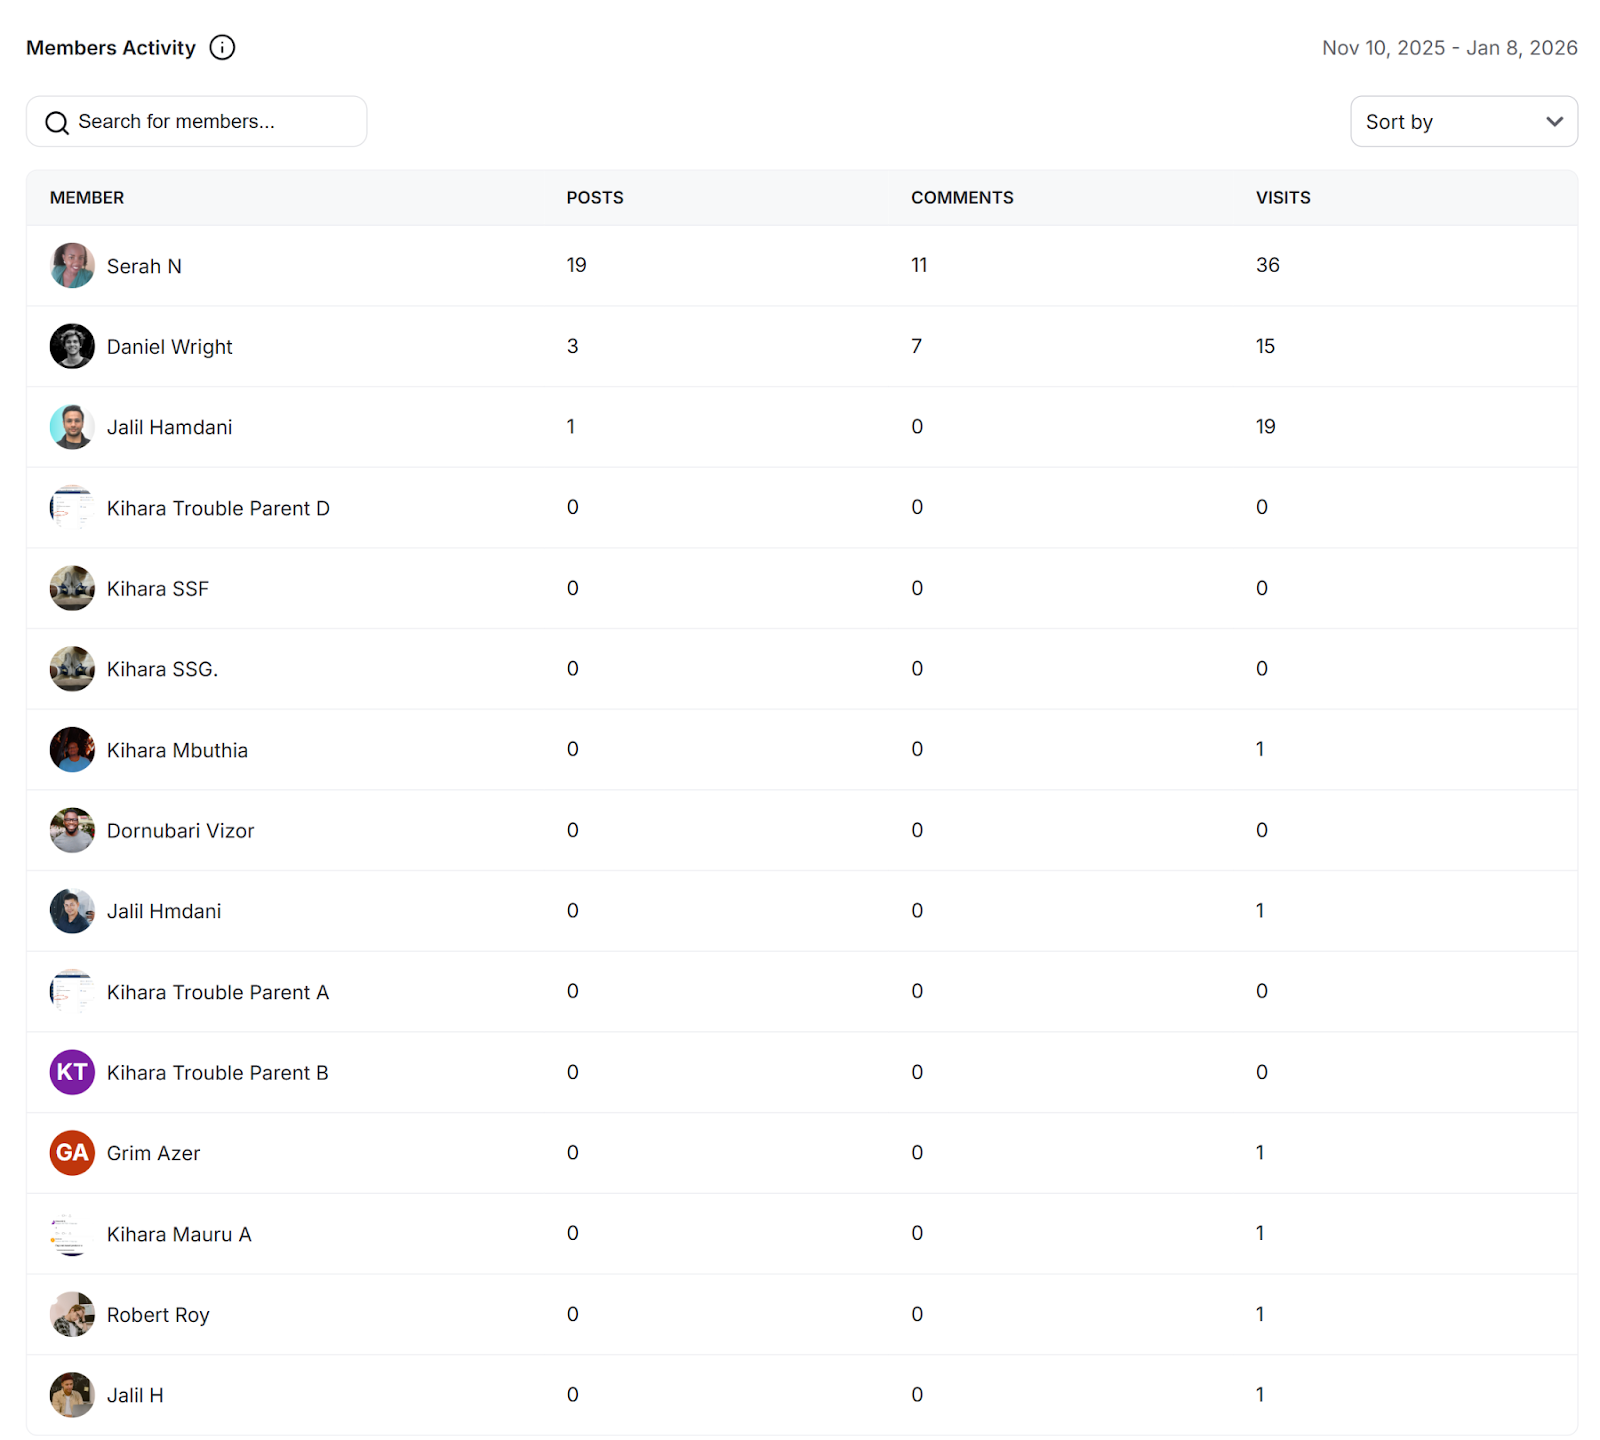
Members Activity: Sort member activity based on community visits, posts, and comments created.
This section displays 2 charts:
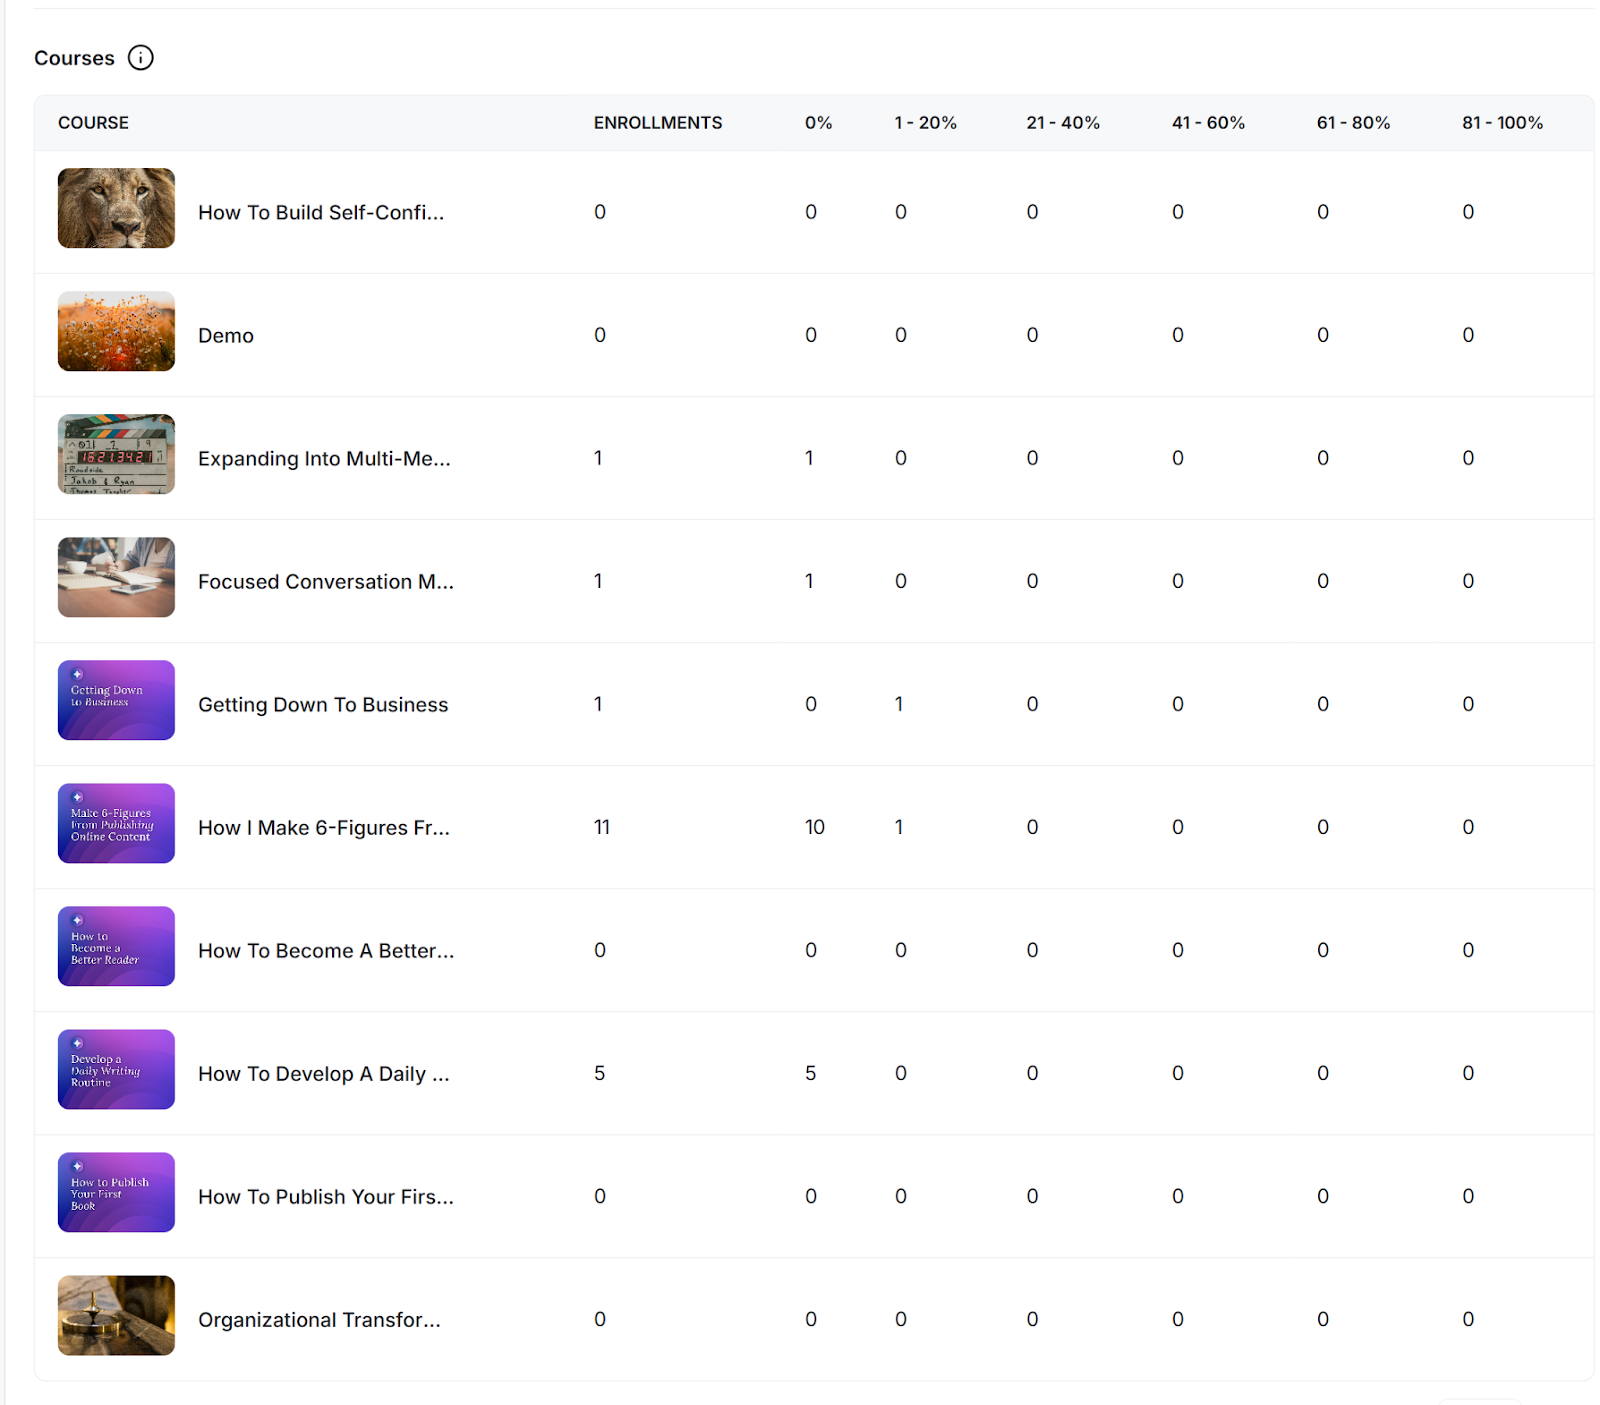
Courses: Course enrollment and completion rate.
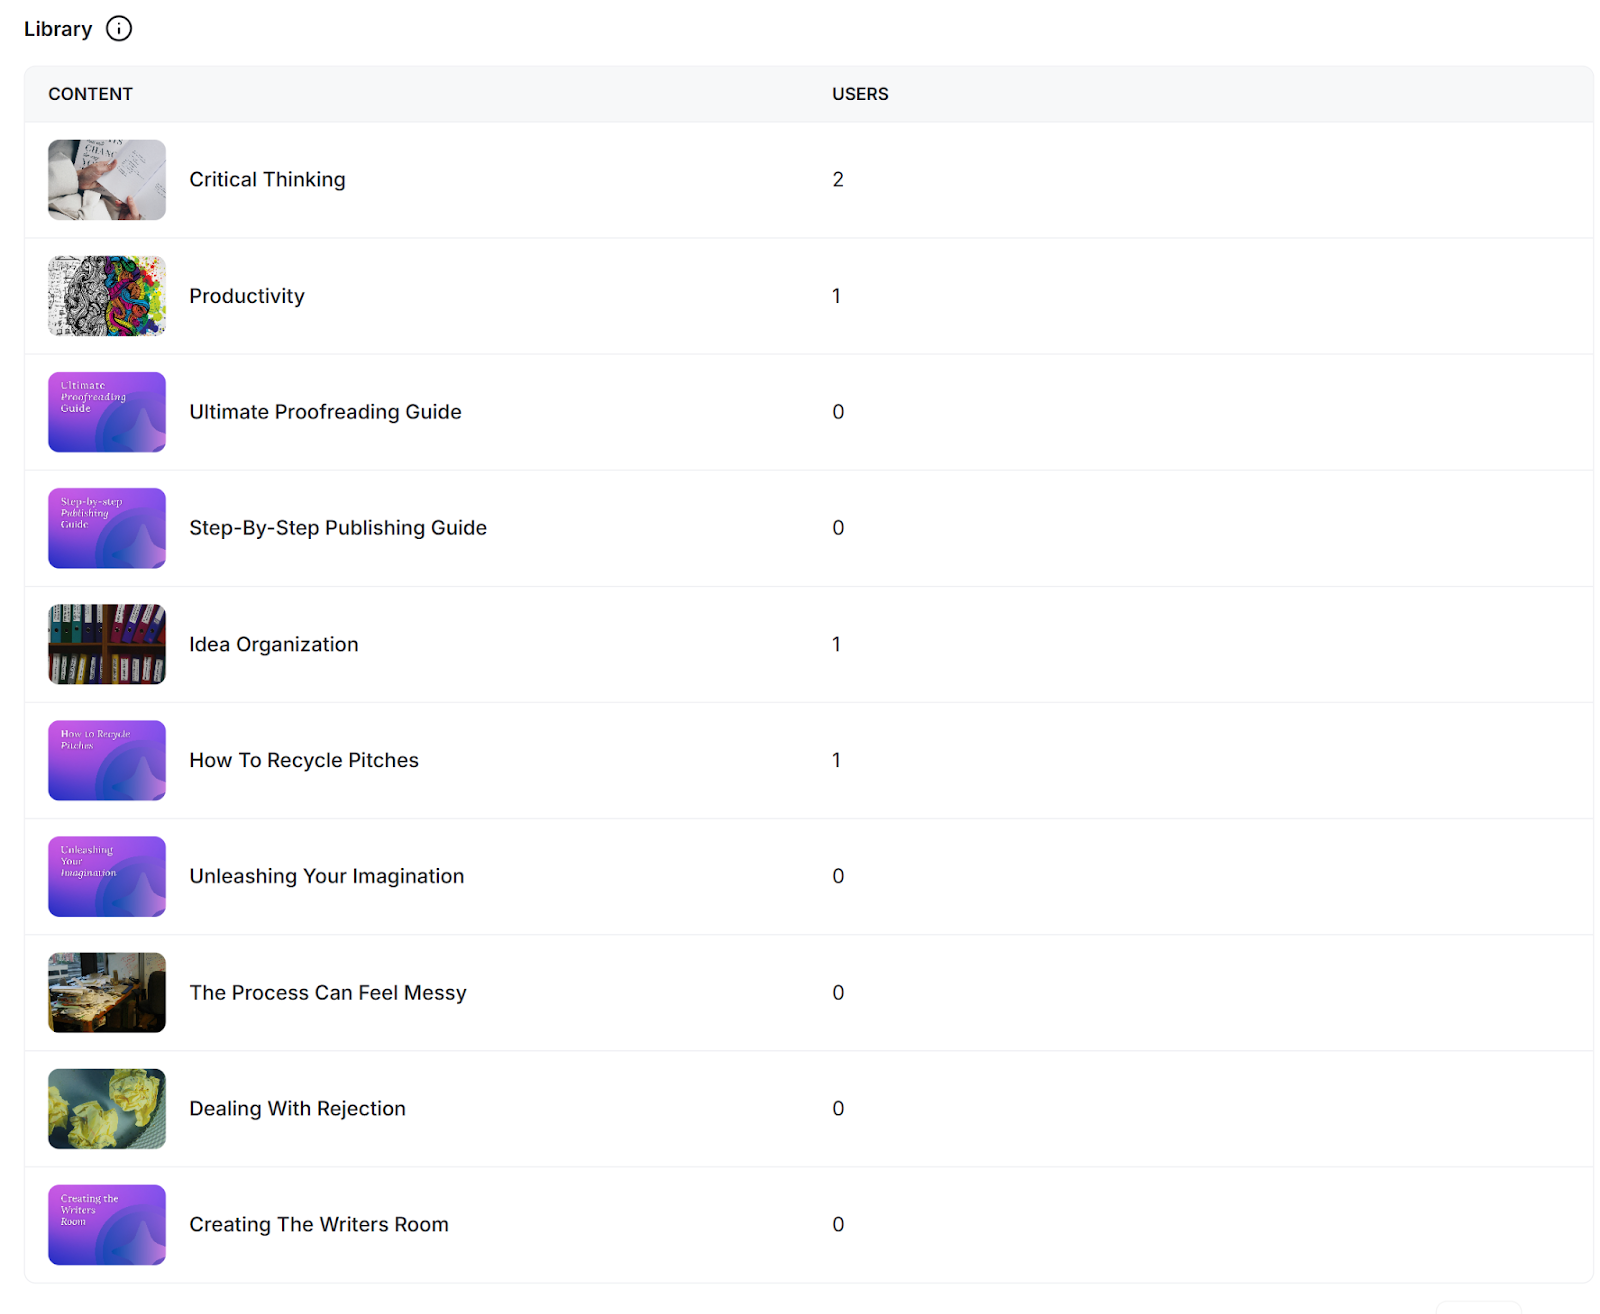
Library: The total number of members who have accessed your content
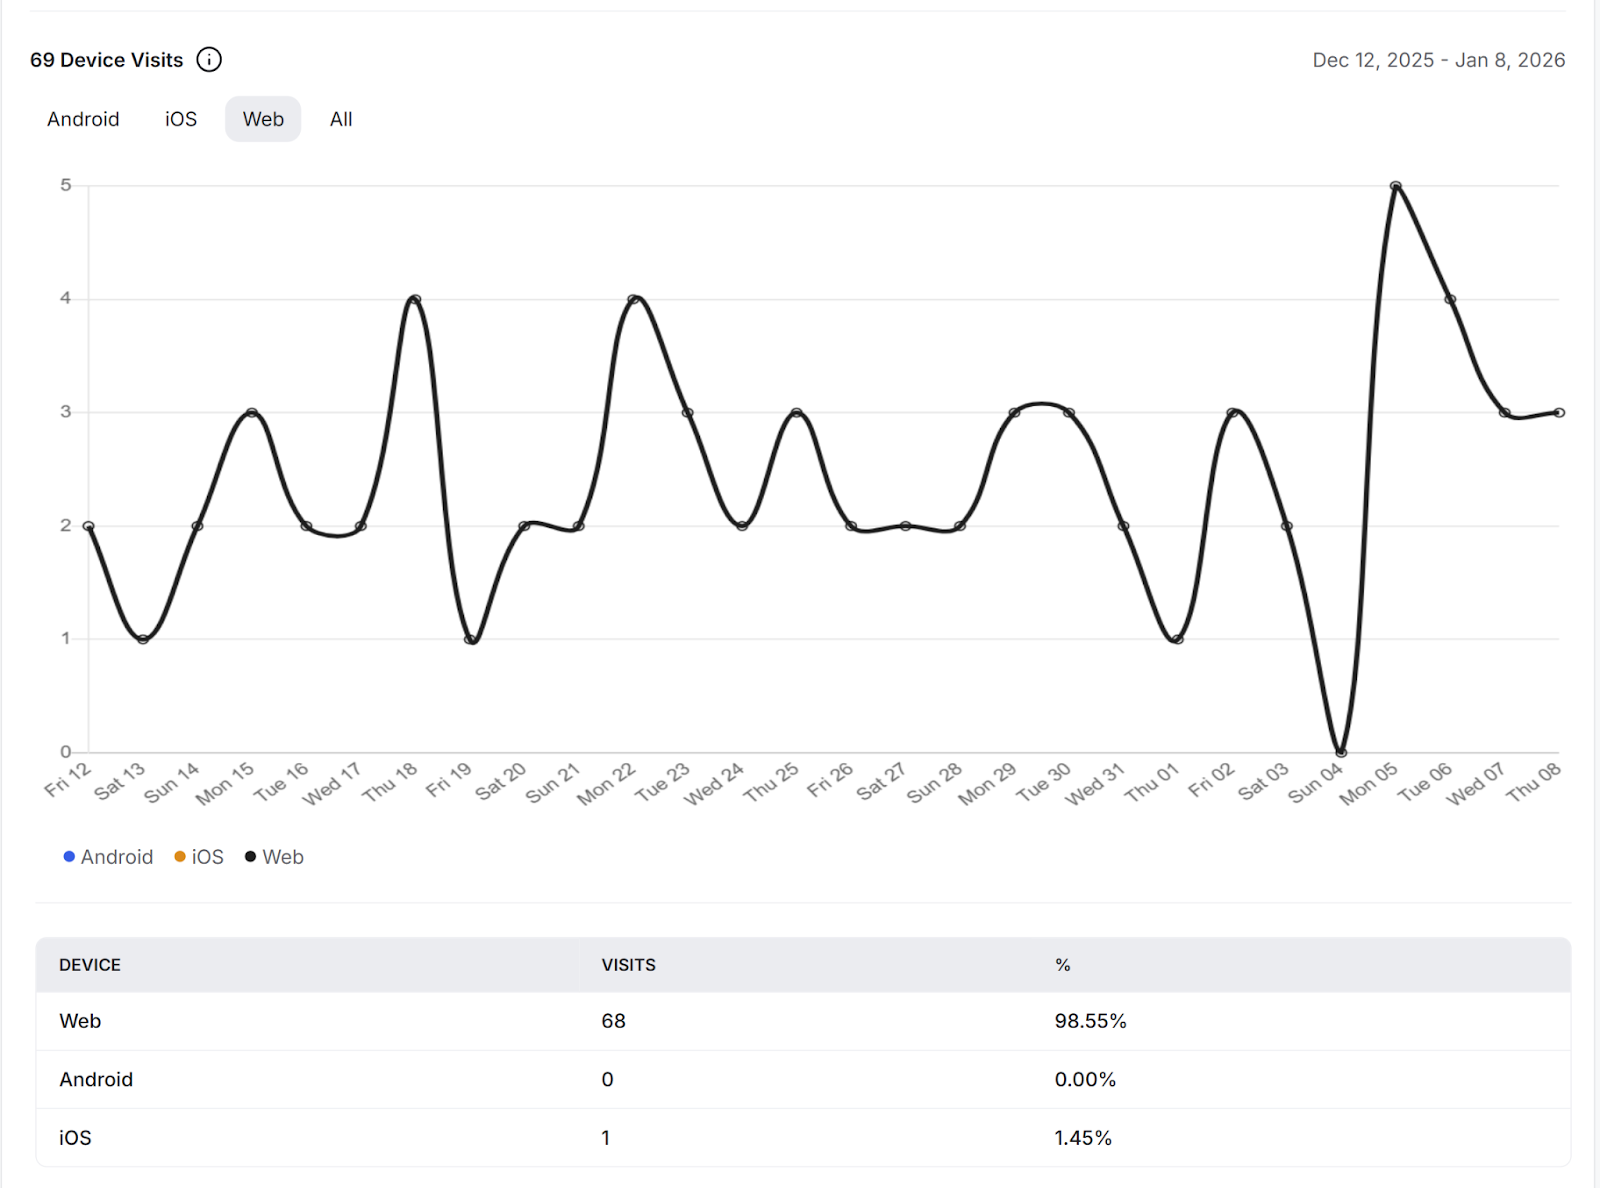
Device Visits: The unique members' visits by device type.
Note: You can use these sorting options for the data on the specific date range.