Community Analytics helps you understand how your community is growing and how members are interacting with your content. From the Analytics Dashboard, you can track growth, engagement, member activity, content performance, and device usage.
You can view analytics for predefined periods such as the last 7, 30, or 60 days, or select a custom date range to analyze specific time periods.
Please note that analytics data is available only within the dashboard and cannot be downloaded. To ensure consistent reporting across different locations, all analytics timestamps are displayed in UTC.
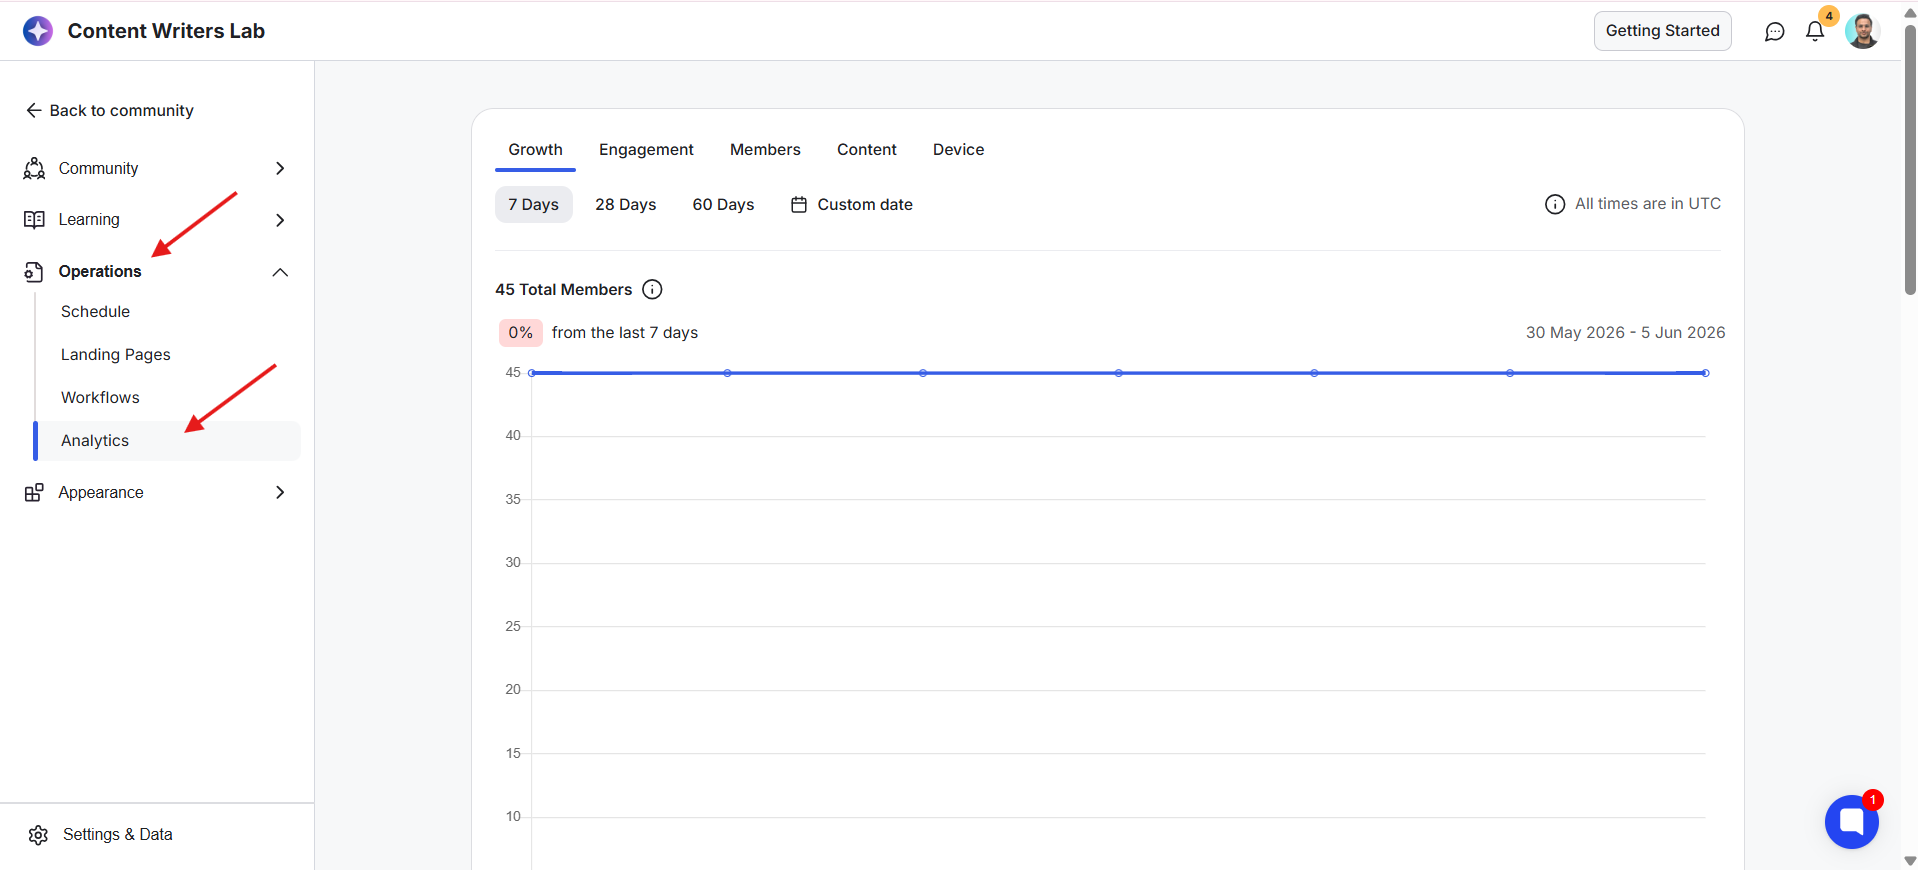
Go to your Admin Panel. Click on Operations from the left-side menu and select Analytics. This opens your Analytics Dashboard.
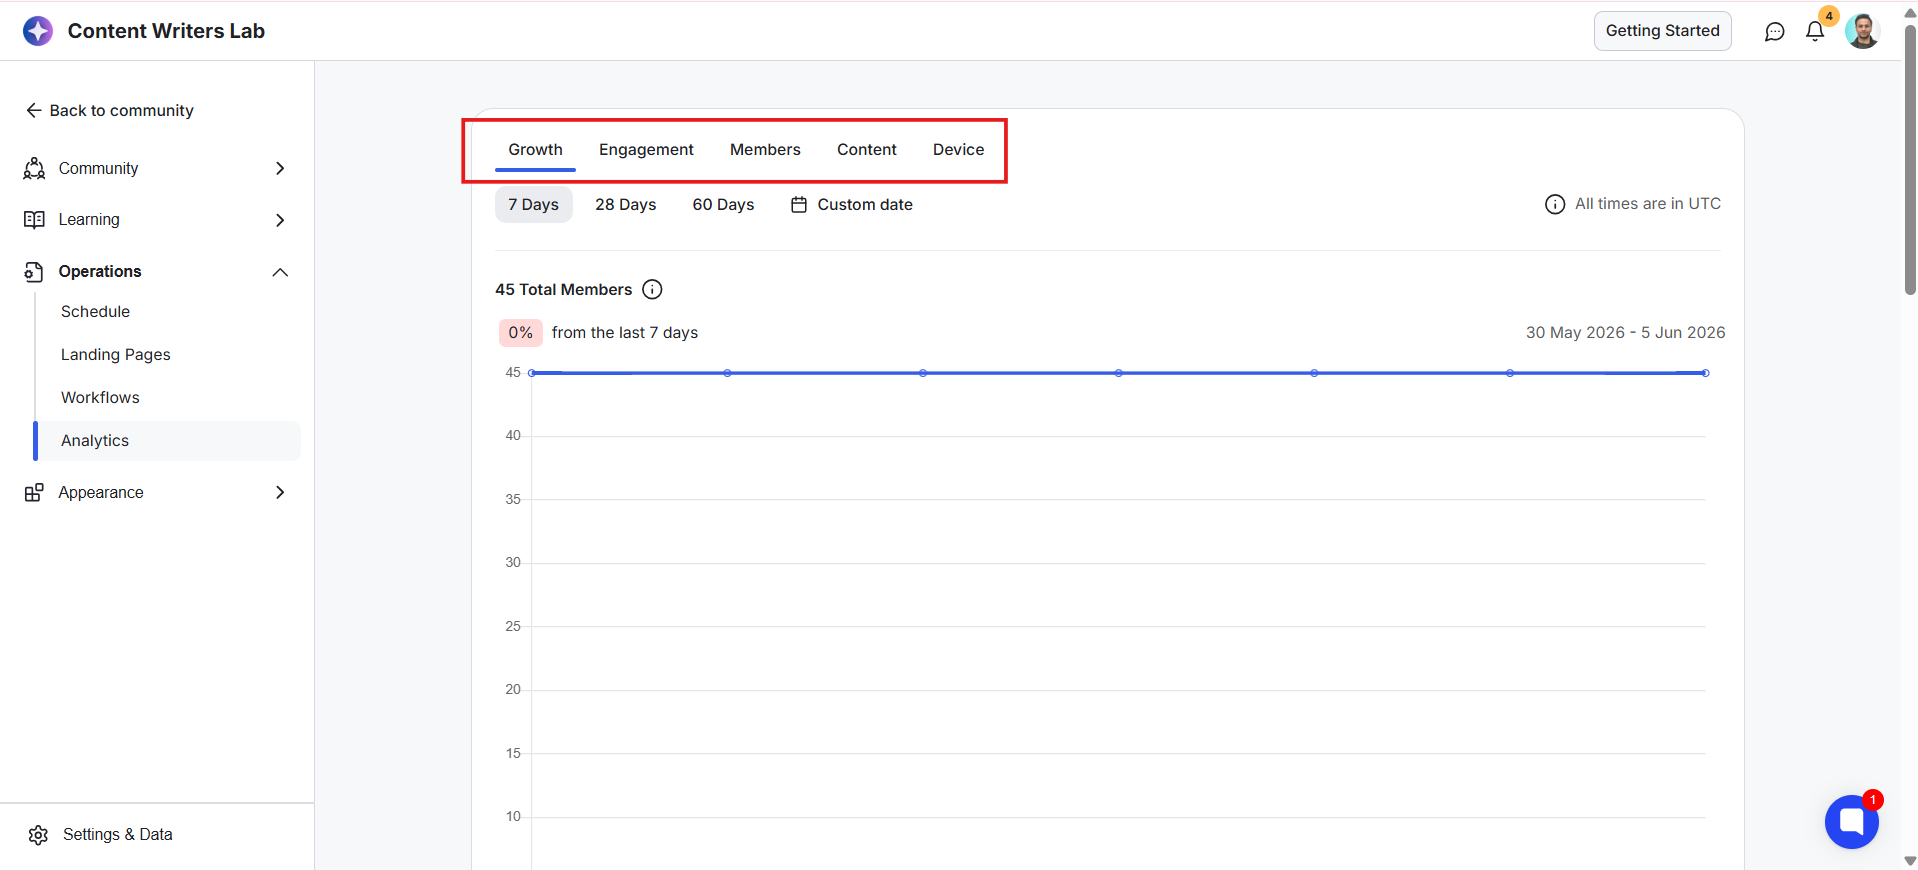
At the top of the dashboard, you'll find five tabs that organize your analytics into different categories:
Growth: Track member growth and membership requests.
Engagement: Measure activity such as posts, comments, direct messages, and active members.
Members: View member activity and identify your most active members.
Content: Analyze the performance of your courses, library content, newsletters, and landing pages.
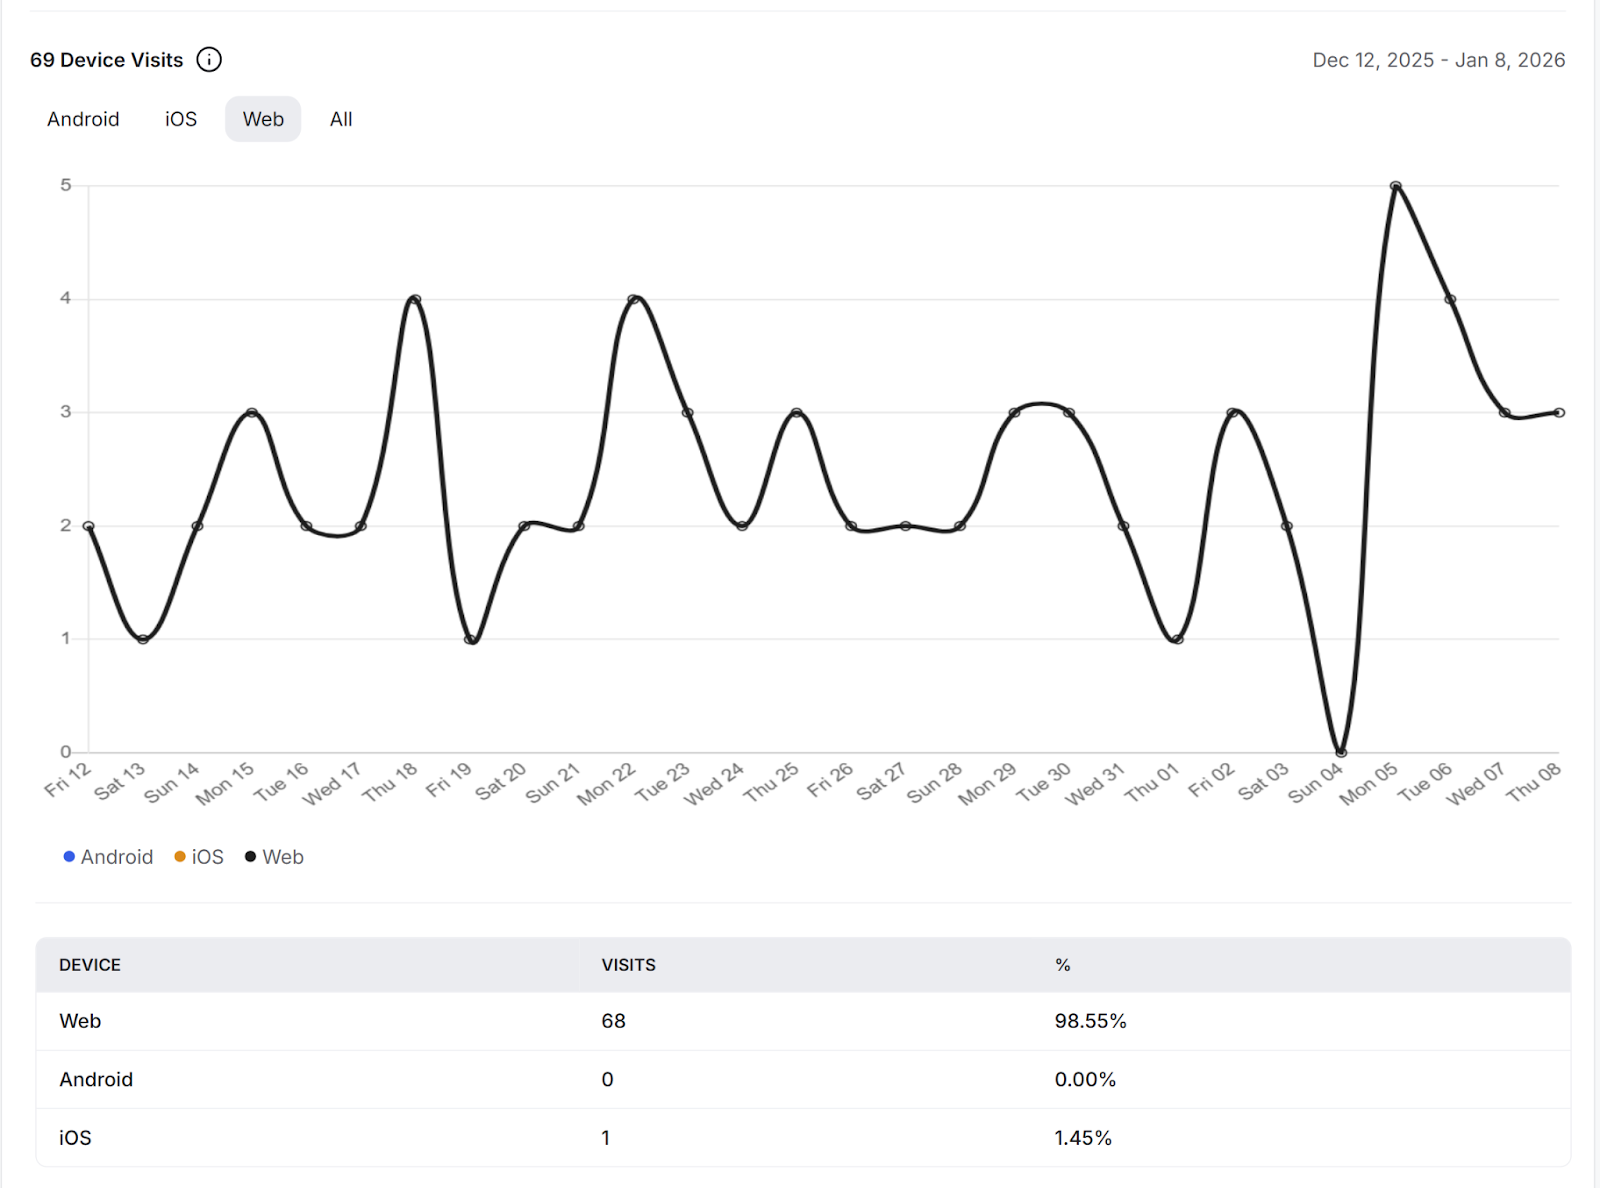
Device: Understand how members access your community across different device types.
Now, let's go through each analytics section and understand the insights available within them.
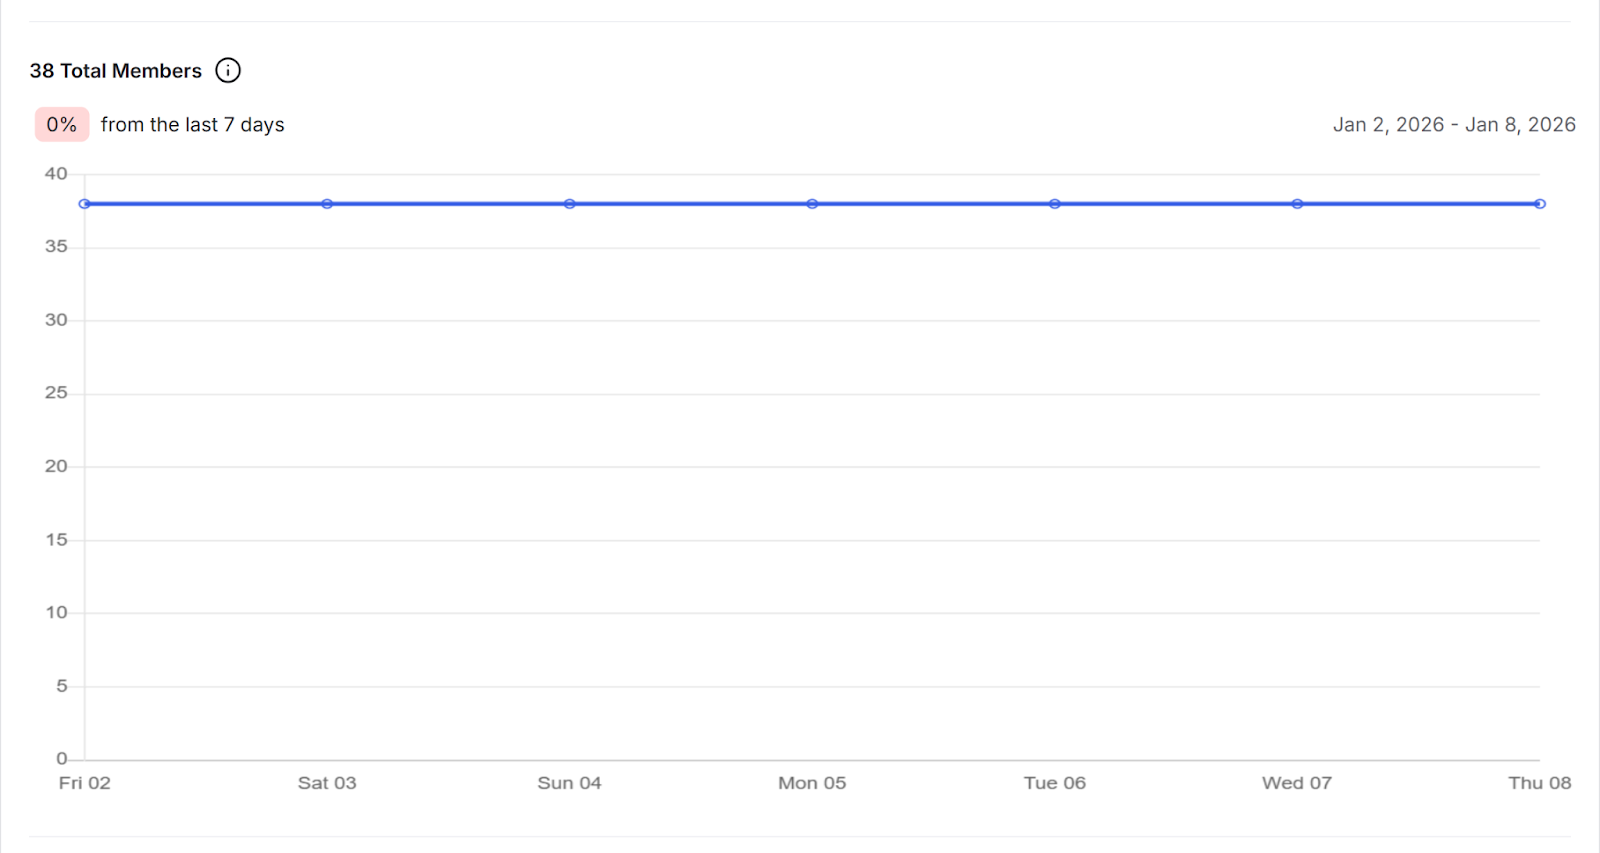
The Growth tab helps you understand how your community is growing over time. It includes the following 3 insights:
Total Members: Shows the total number of members in your community.
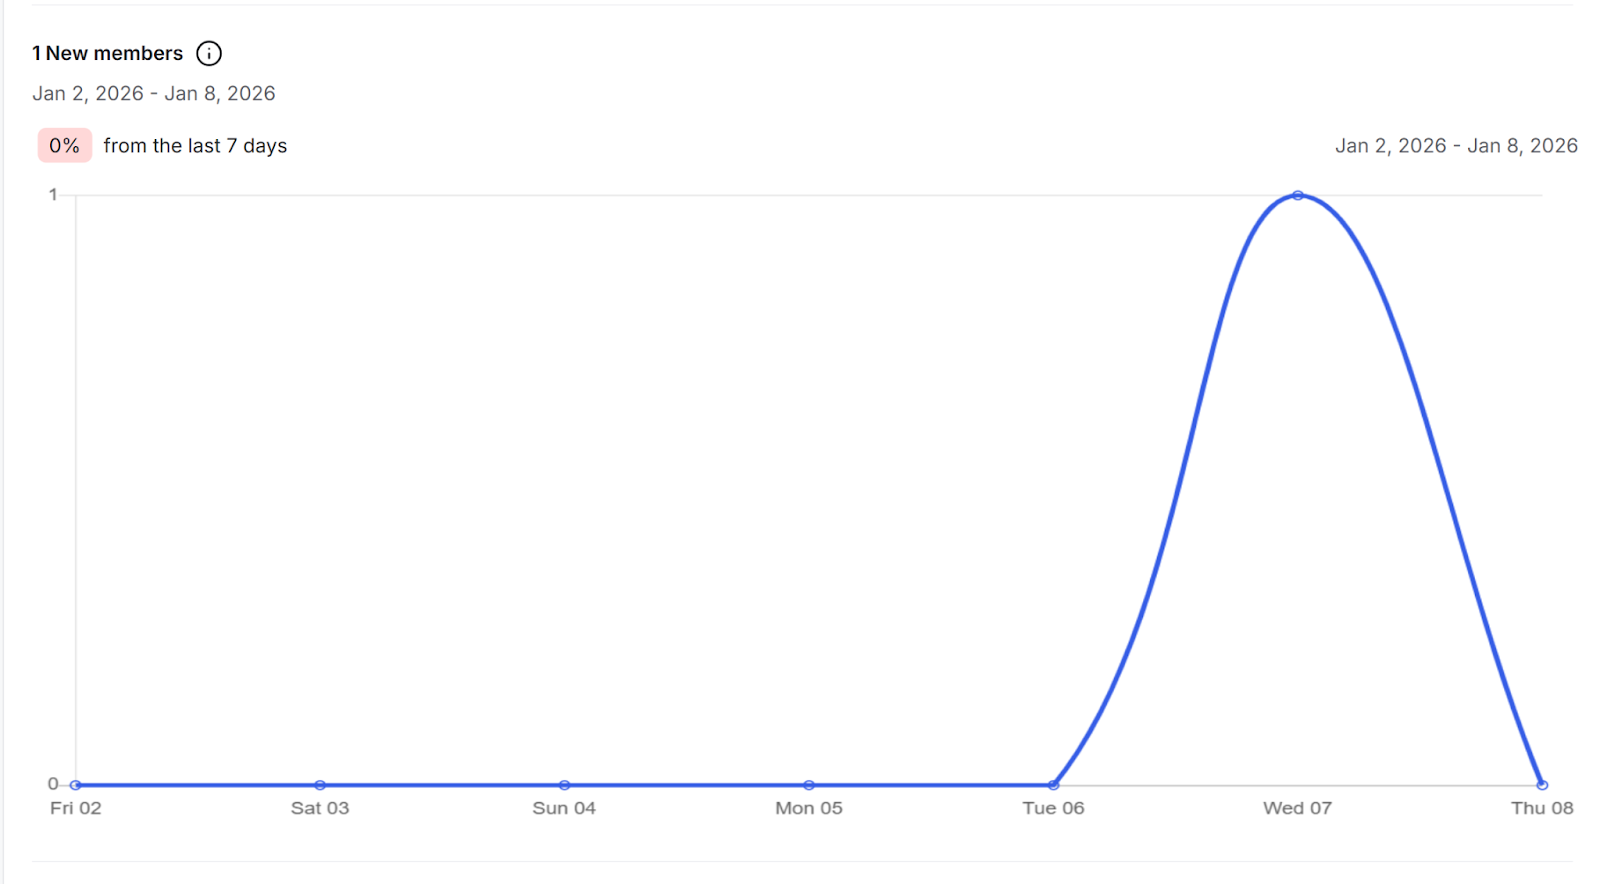
New members: Shows the number of new members who joined your community during the selected time period.
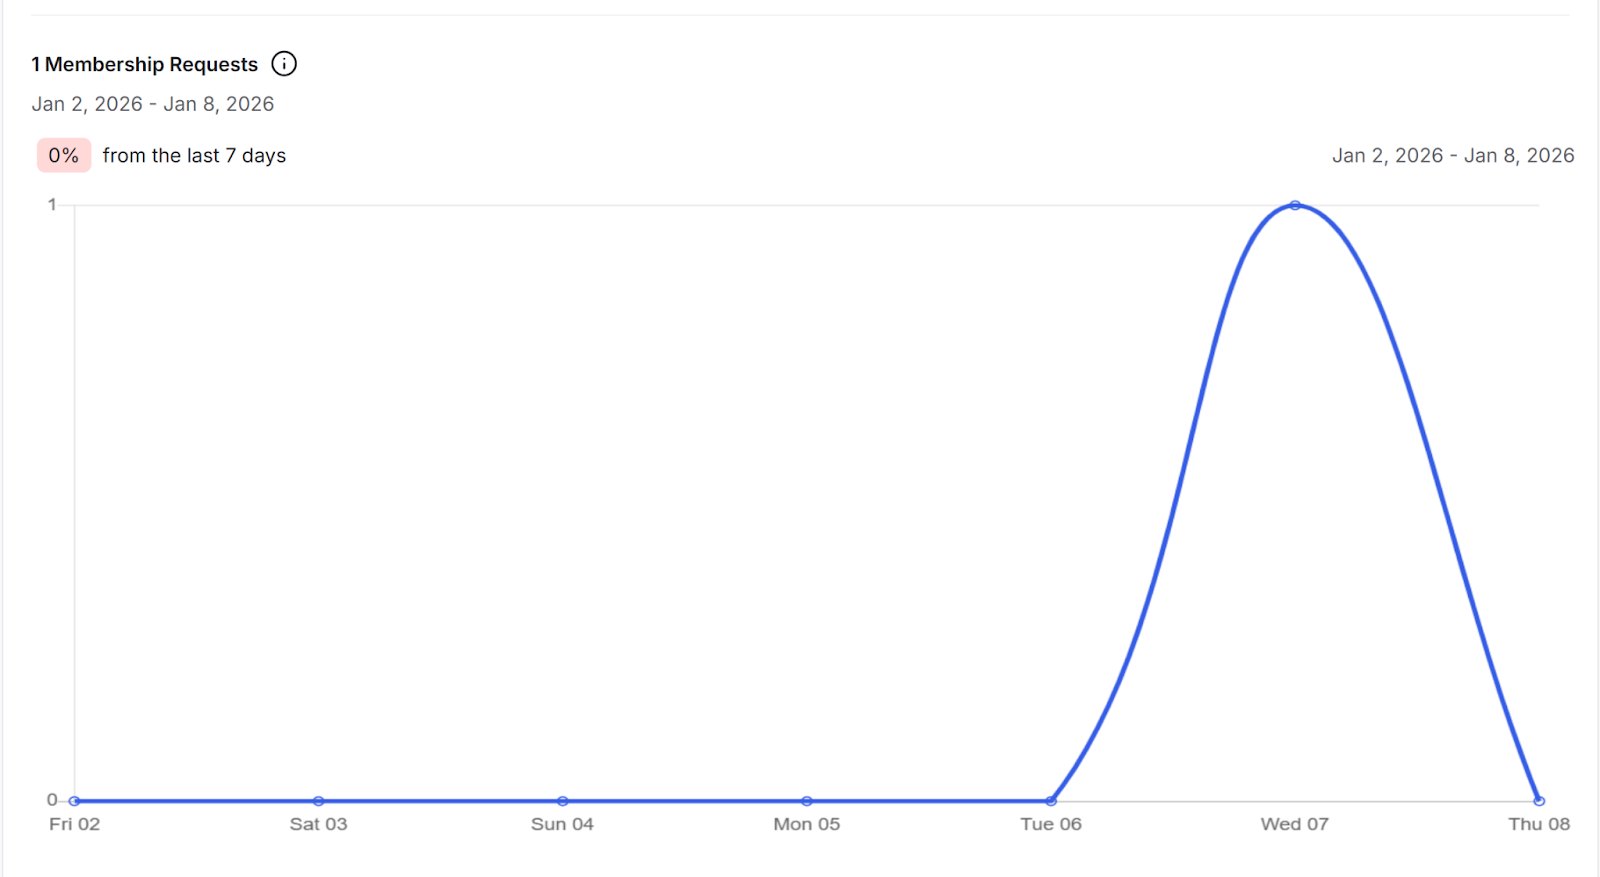
Membership Requests: the number of people who requested to join your community during the selected time period.
The Engagement tab helps you understand how members are interacting with your community. It includes the following insights:
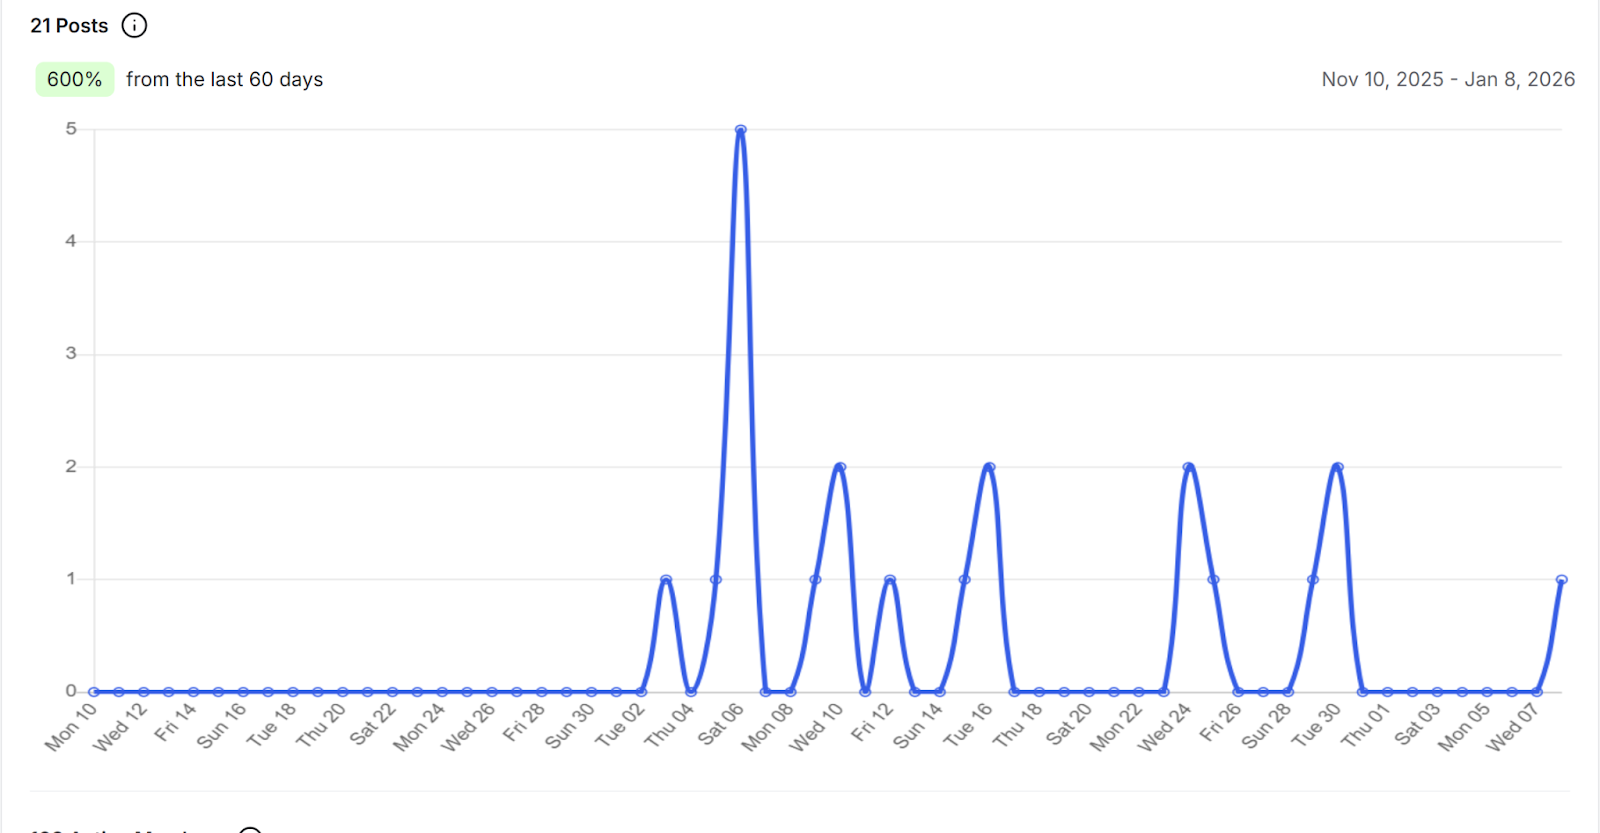
Posts: The number of posts created.
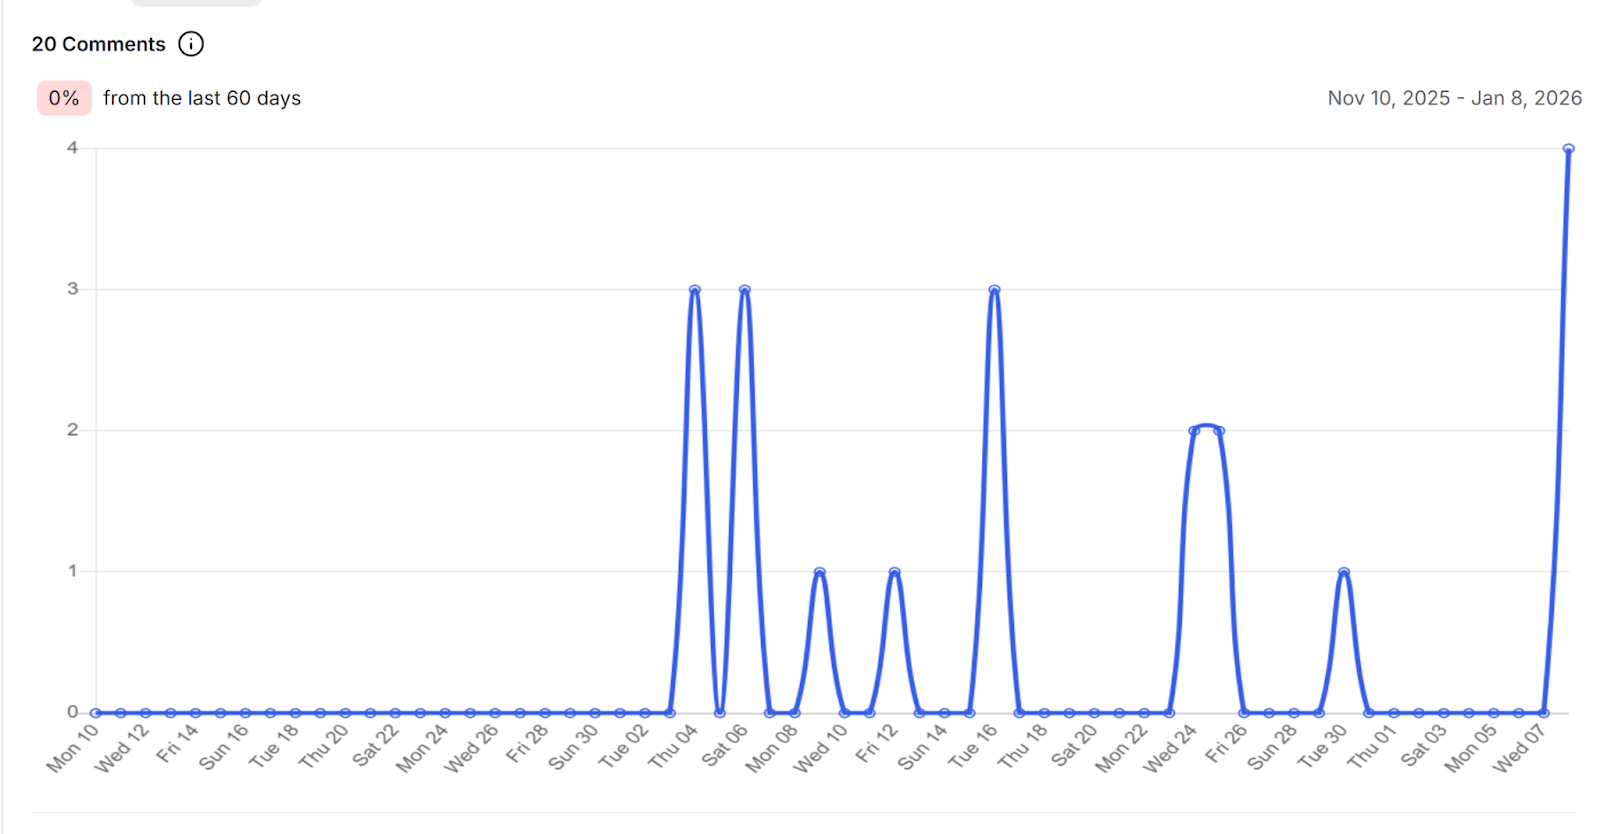
Comments: The number of comments created.
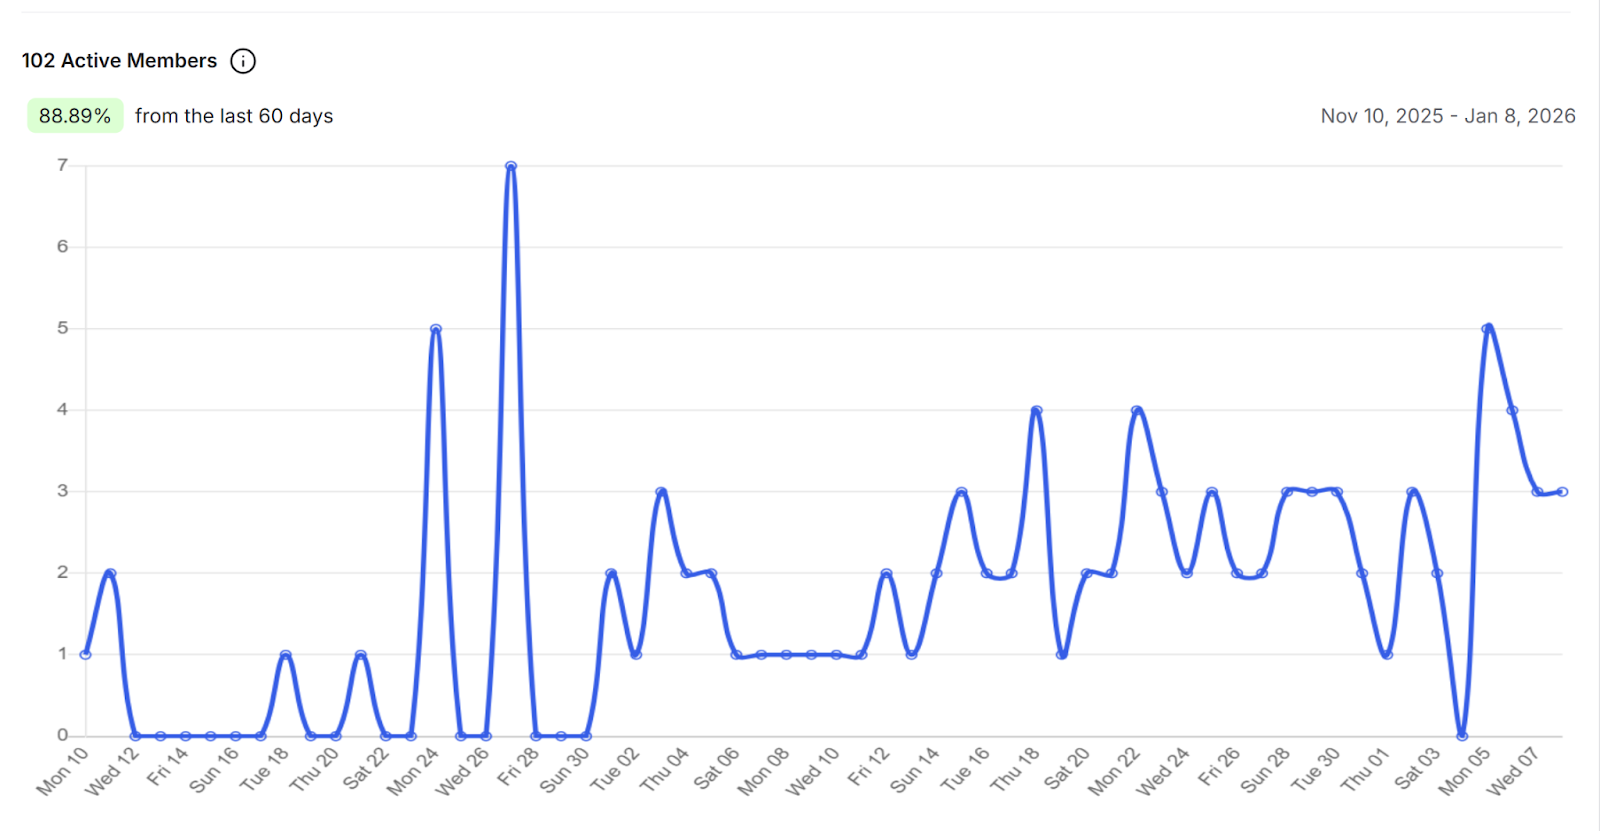
Active Members: The number of unique members who visited your community.
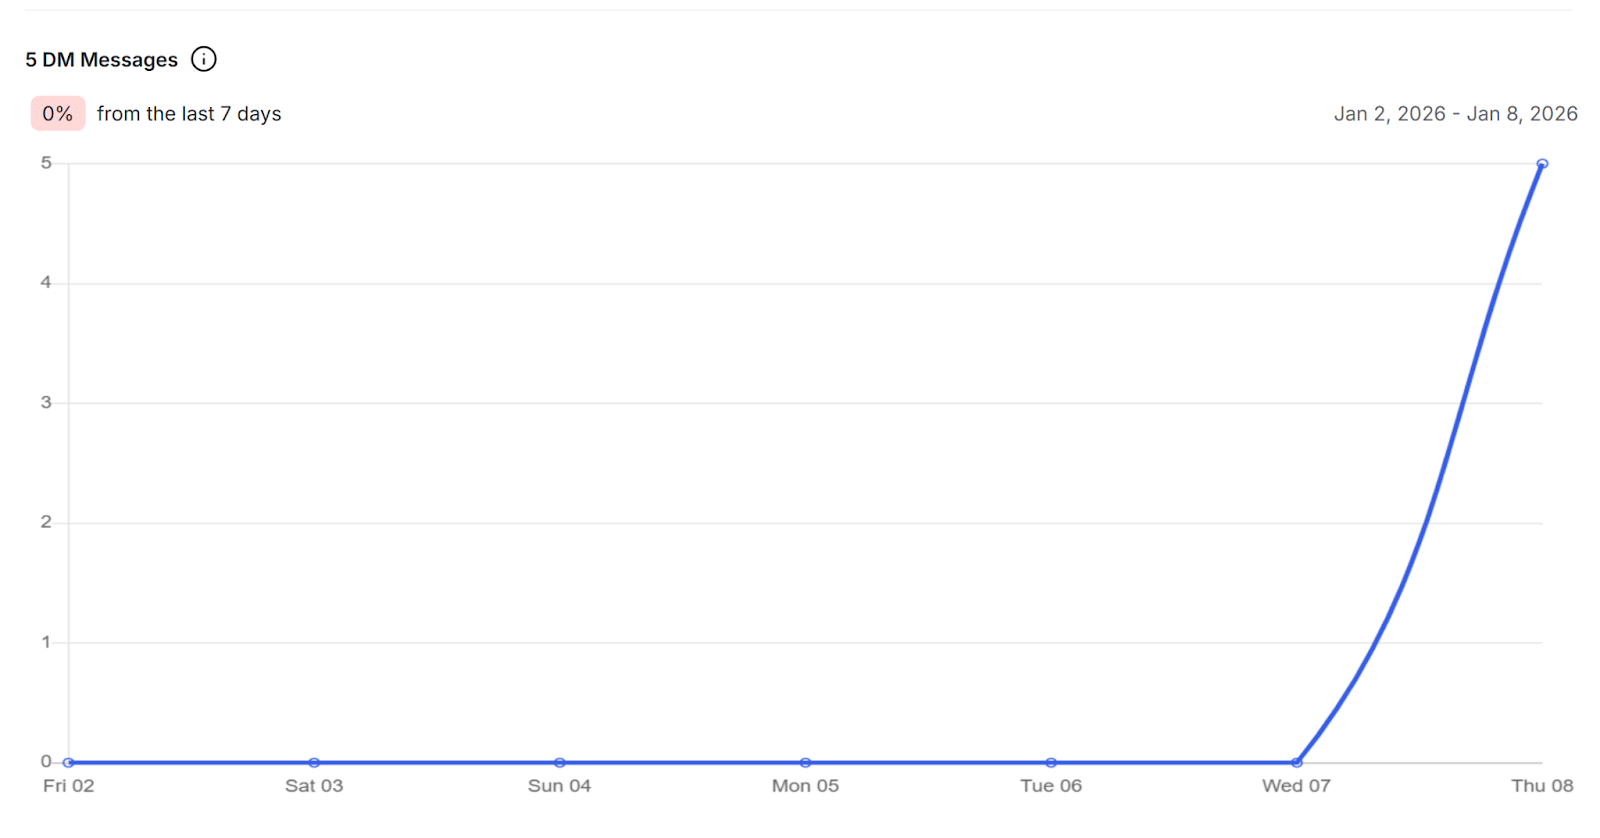
Direct Messages (DMs): The number of direct messages sent by members.
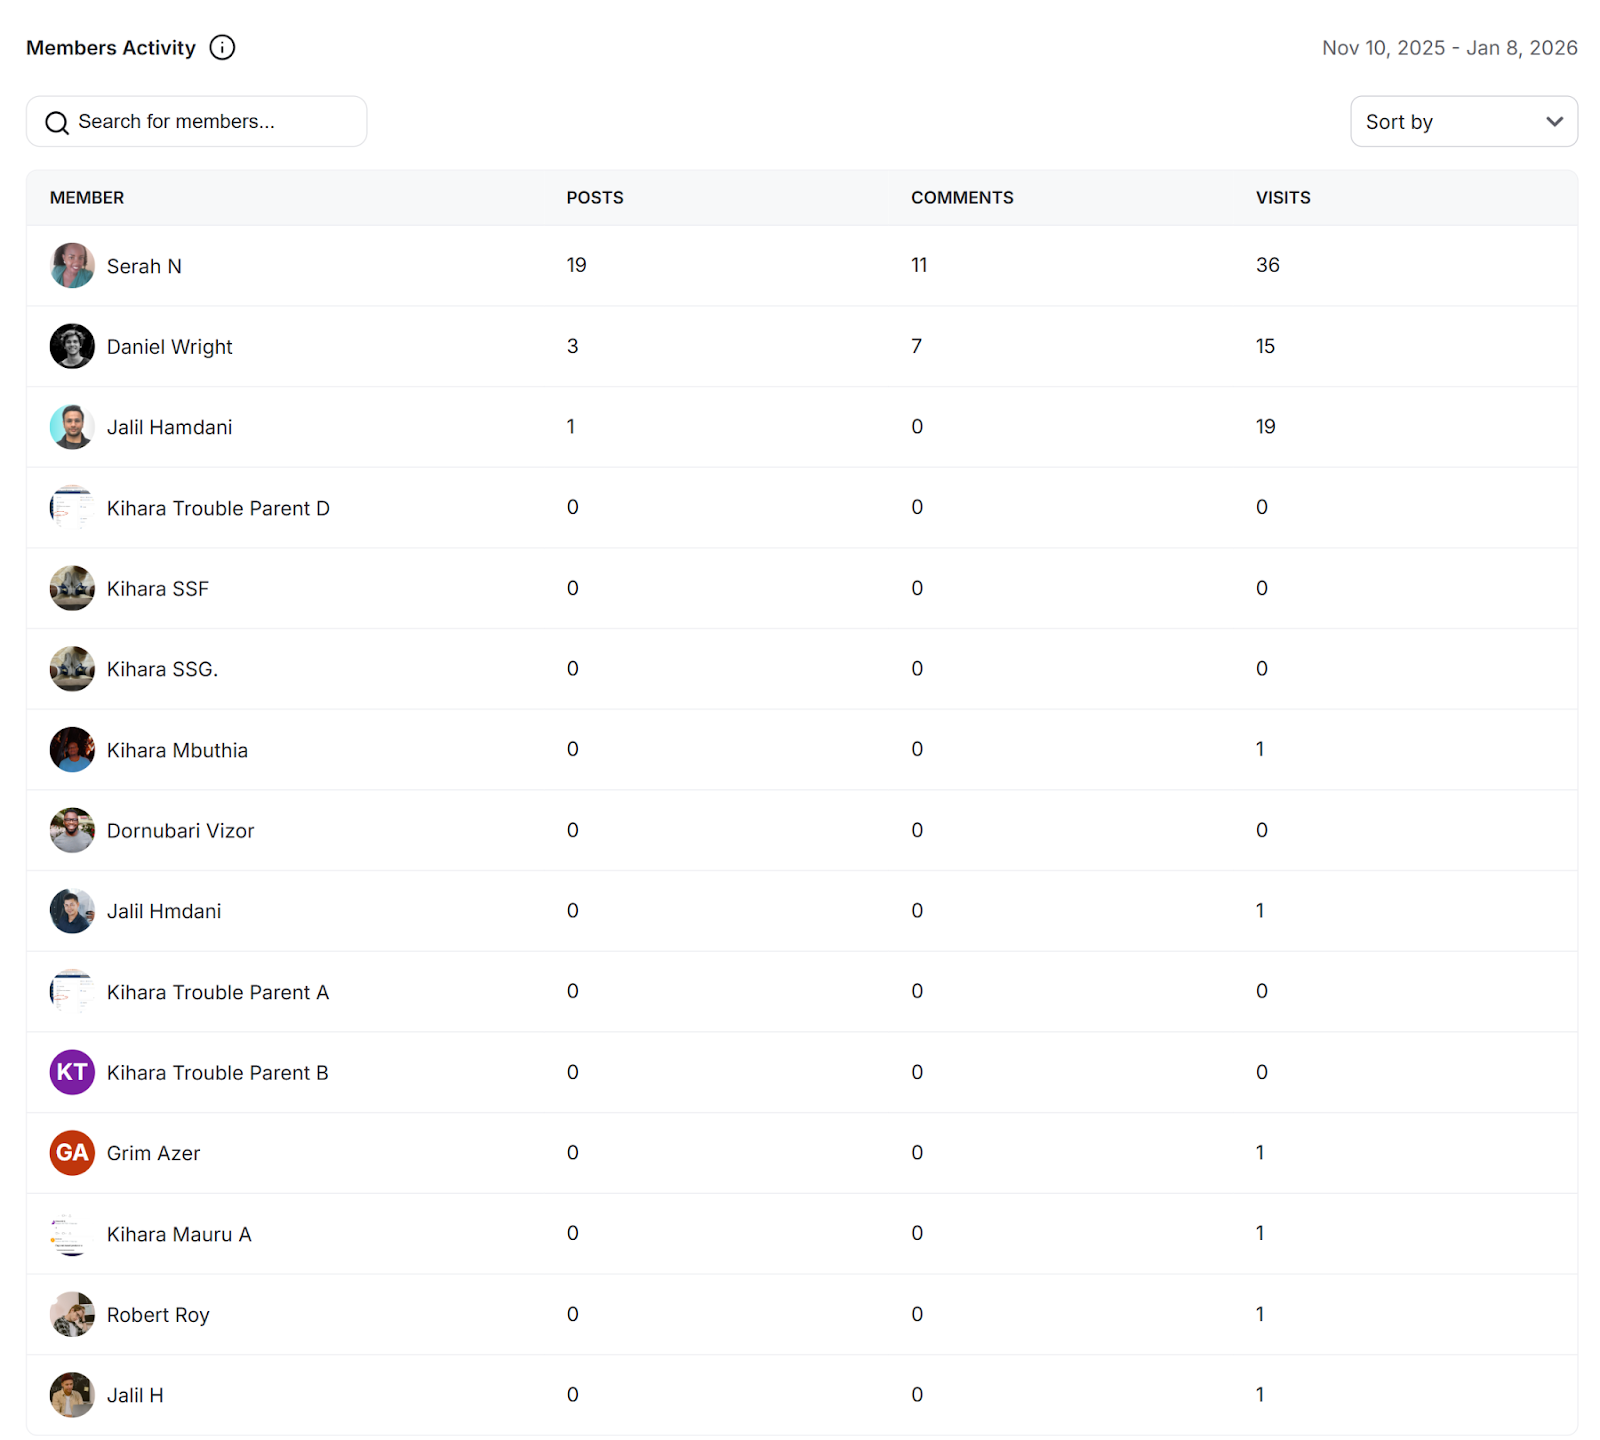
The Members tab helps you understand how individual members are participating in your community. It displays member activity based on community visits, posts created, and comments created.
You can use this information to identify your most active members and better understand how members are engaging with your community.
The Content tab helps you understand how members are interacting with the different types of content in your community. It includes the following insights:
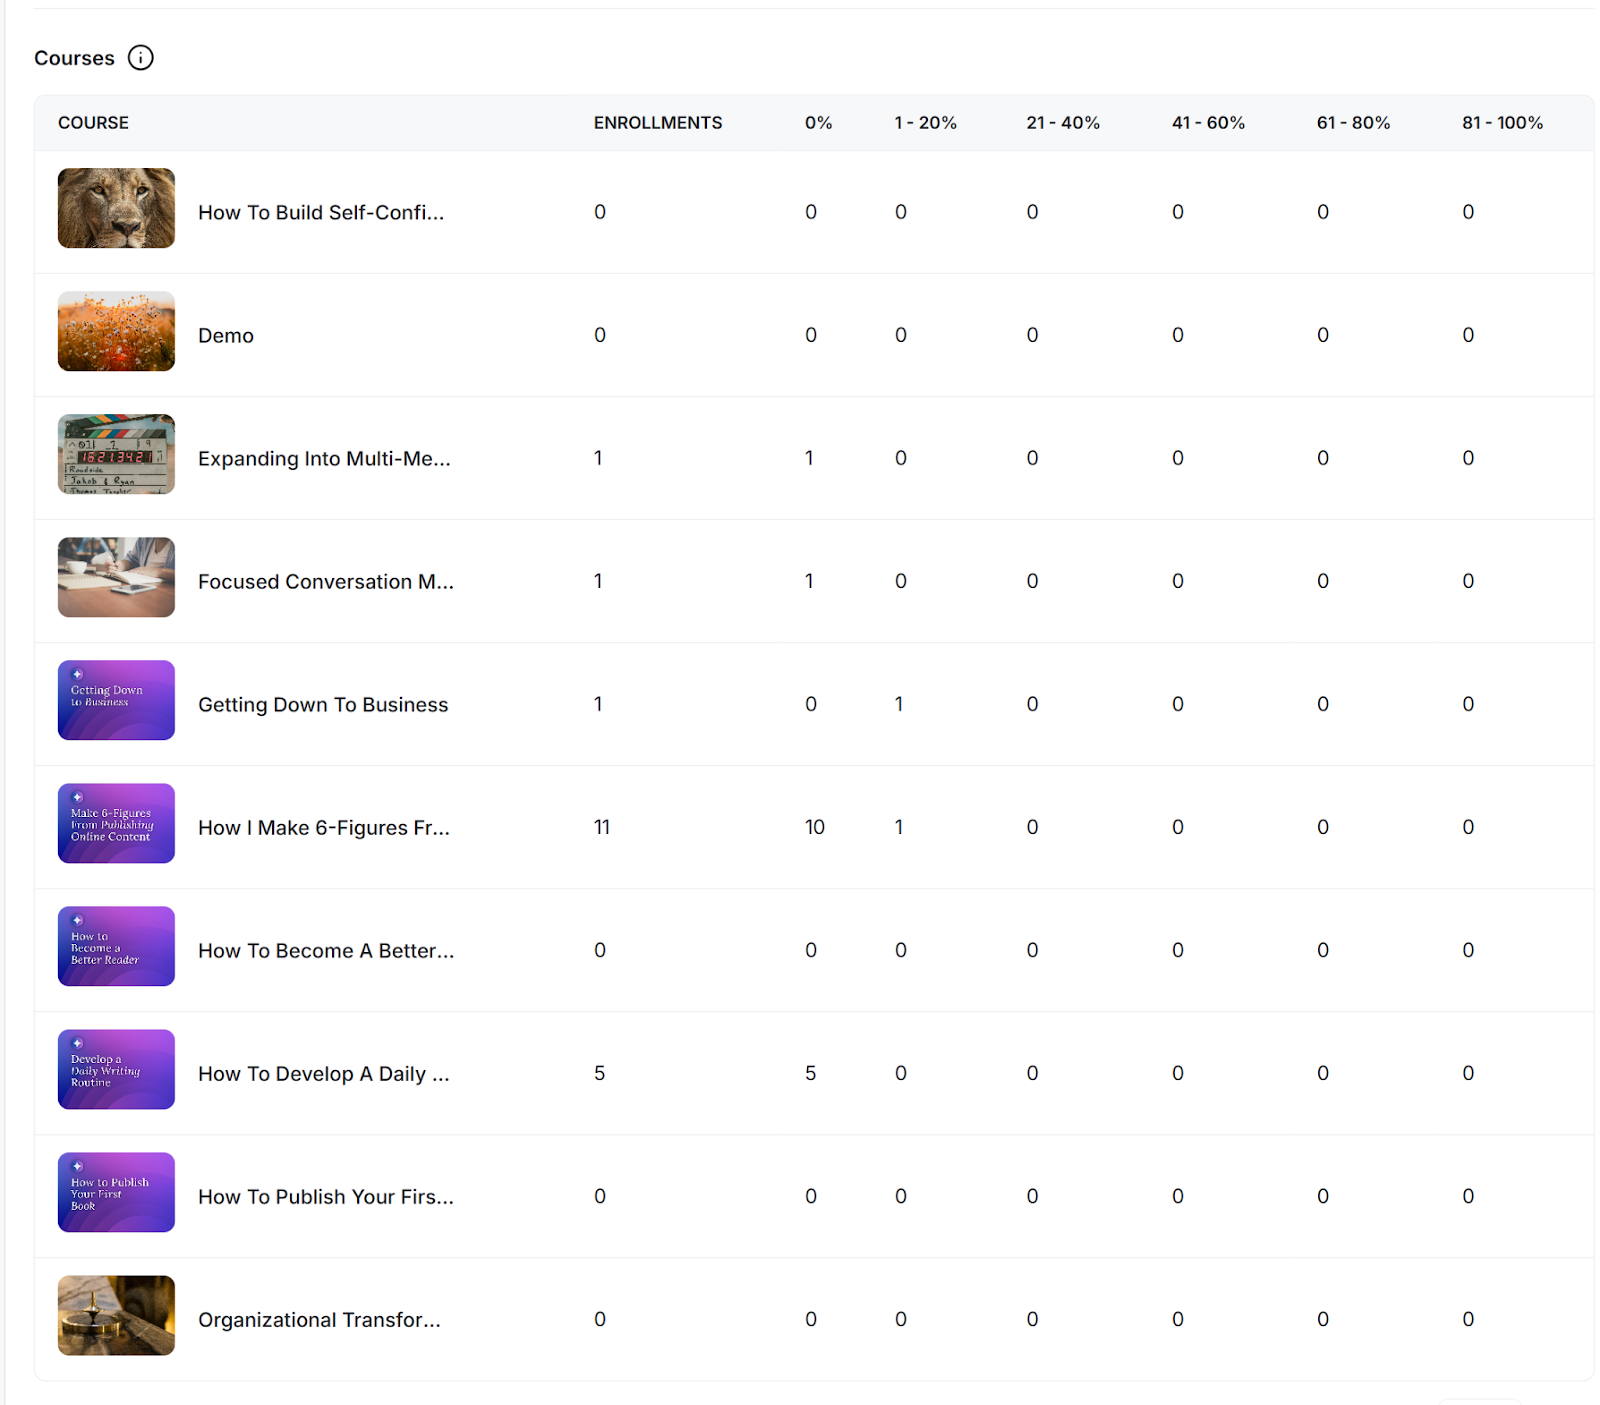
Courses: Shows enrollment and completion analytics for each published course, helping you understand how learners are progressing through your content.
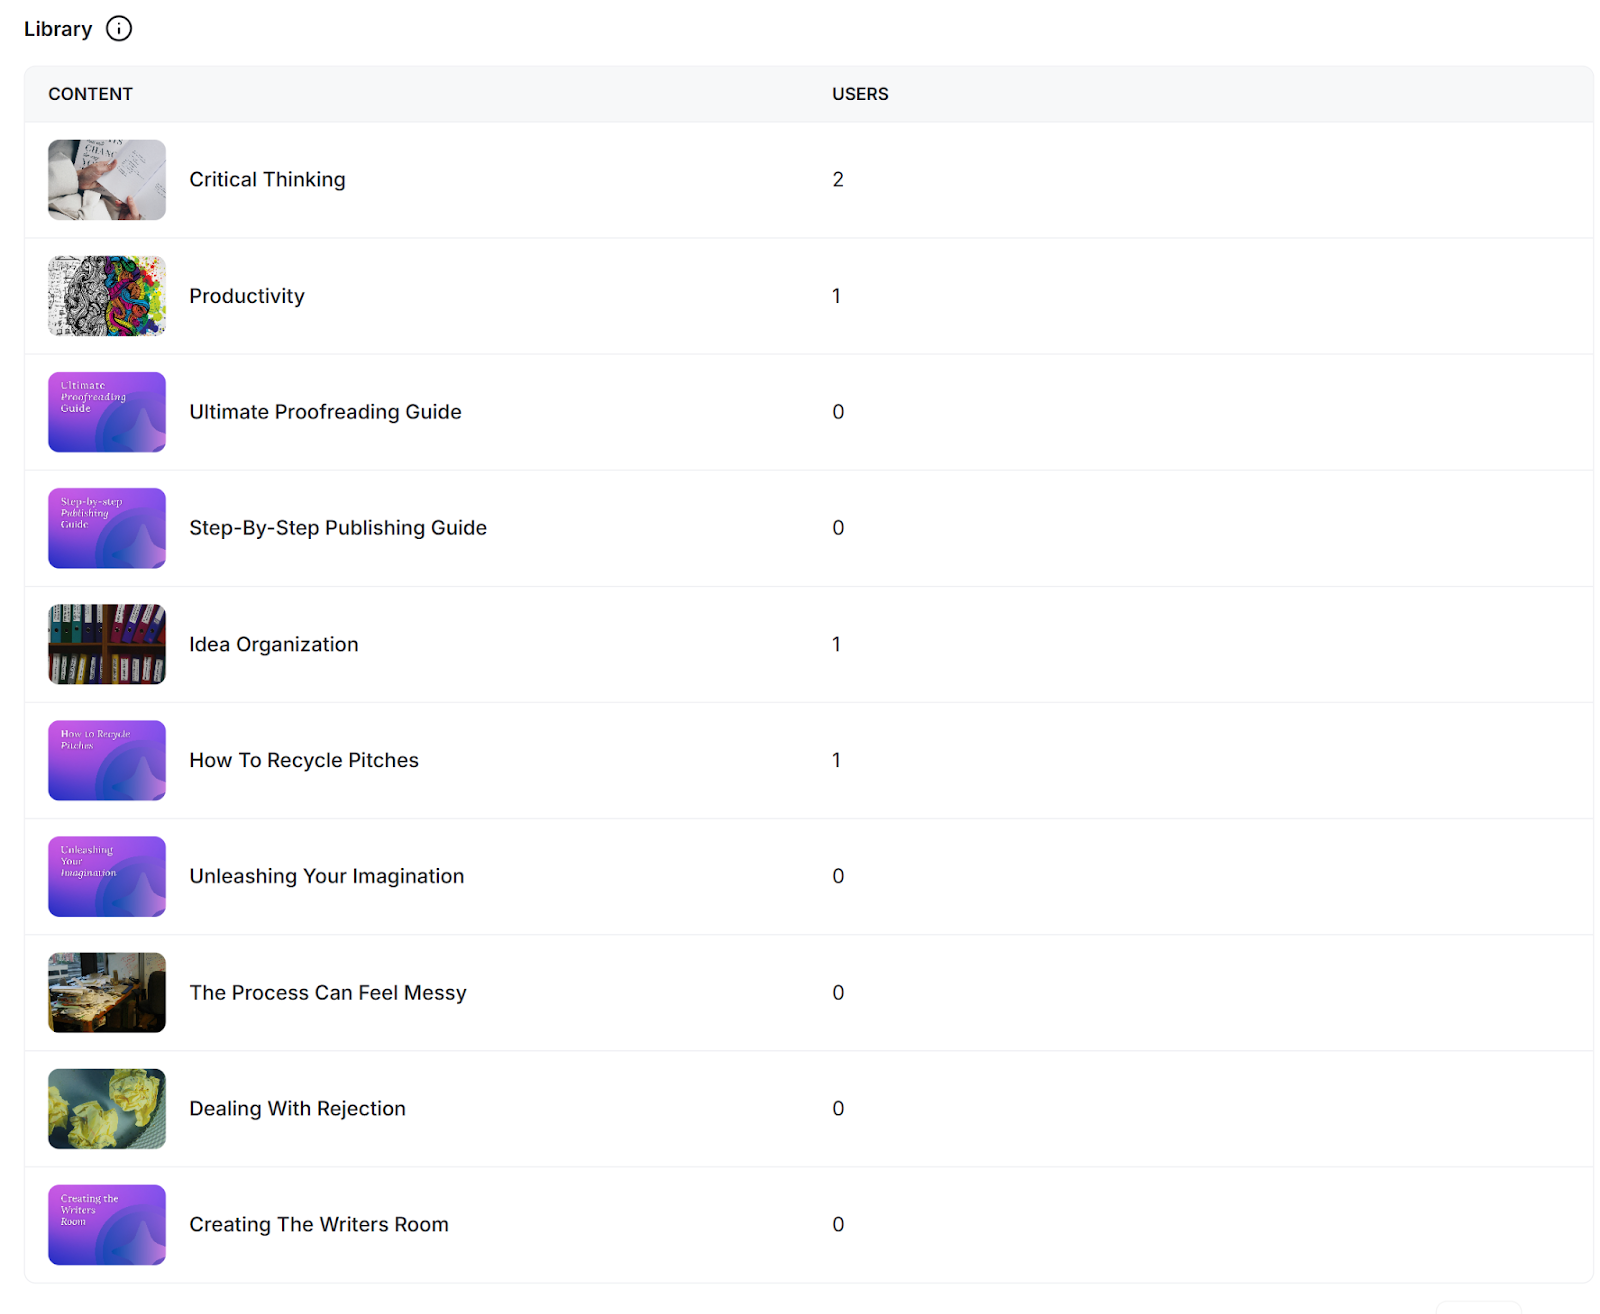
Library: Shows the total number of members who have accessed each published resource in your library.
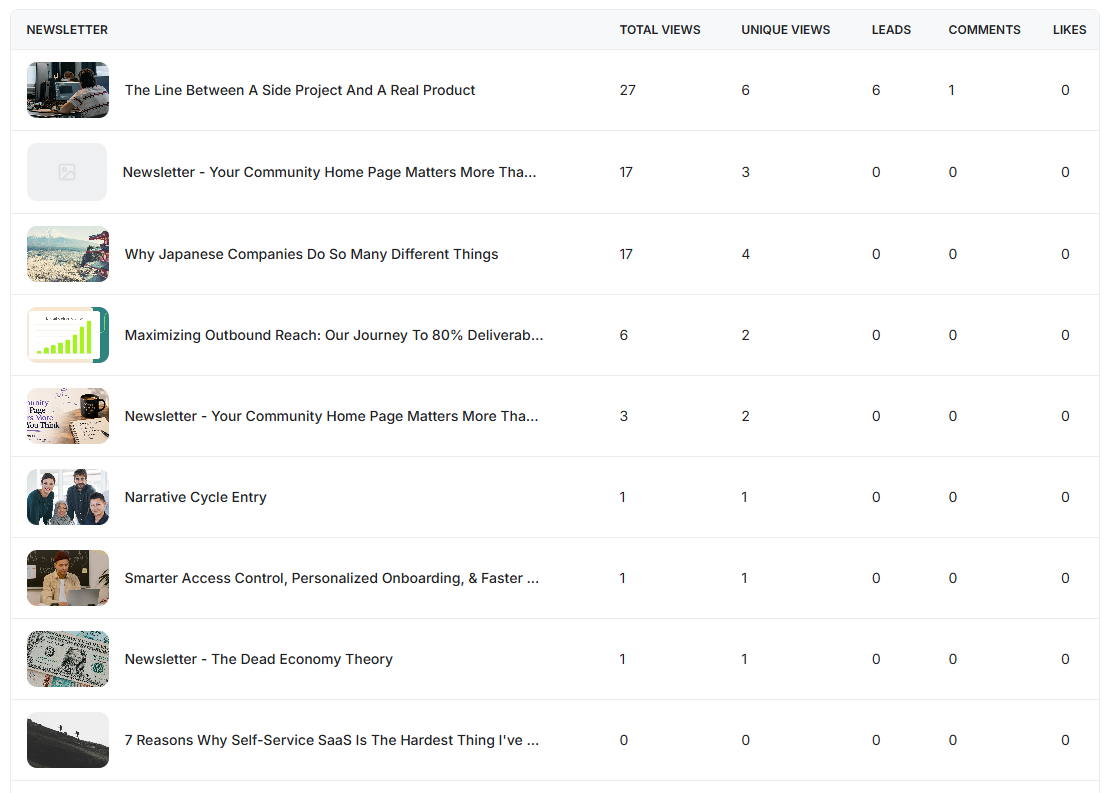
Newsletters: Shows analytics for each published newsletter, including total views, unique visits, comments, and likes. It also displays the number of leads, which are people who entered their email address to read the full newsletter. These leads can be viewed from the Leads section in the People Dashboard.
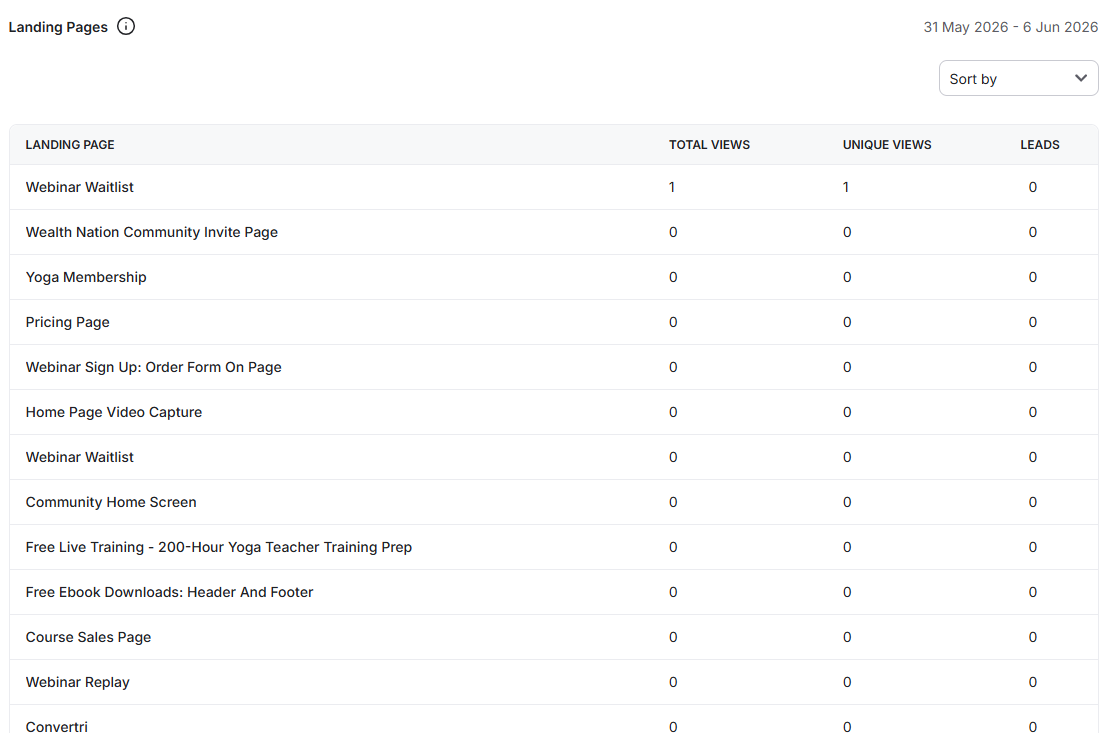
Landing Pages: Shows total views and unique visits for each landing page. If a landing page contains a form, you can also track the number of leads generated from form submissions.
Shows the number of unique member visits by platform, helping you understand how many members are accessing your community through iOS, Android, and the web.